How can a wave tell whether tissue is soft or stiff? Elastography answers by watching how tissue moves when it is gently disturbed. The resulting map adds a mechanical clue to an anatomical image: two regions that look similar in shape may respond differently to the same wave. That clue can help clinicians assess conditions such as liver fibrosis, but it is a measurement of relative stiffness, not a direct diagnosis on its own.
A mechanical question inside an image
A conventional anatomical image asks where structures are and what shape they have. Elastography asks an additional question: how readily does each region deform or move? Stiffness describes resistance to deformation. Scar tissue, for example, can make an organ mechanically different from healthy tissue, even when the organ’s outline alone does not reveal the change.
Imagine tapping a cushion and a tightly packed book with the same gentle rhythm. The cushion moves more; the book resists. In tissue, the disturbance is a sound wave or another controlled motion, and the response is far subtler. Elastography measures that response and presents differences as a map that can be viewed alongside anatomy. Ultrasound elastography is one functional form of ultrasound imaging [2].
From a wave to a stiffness map
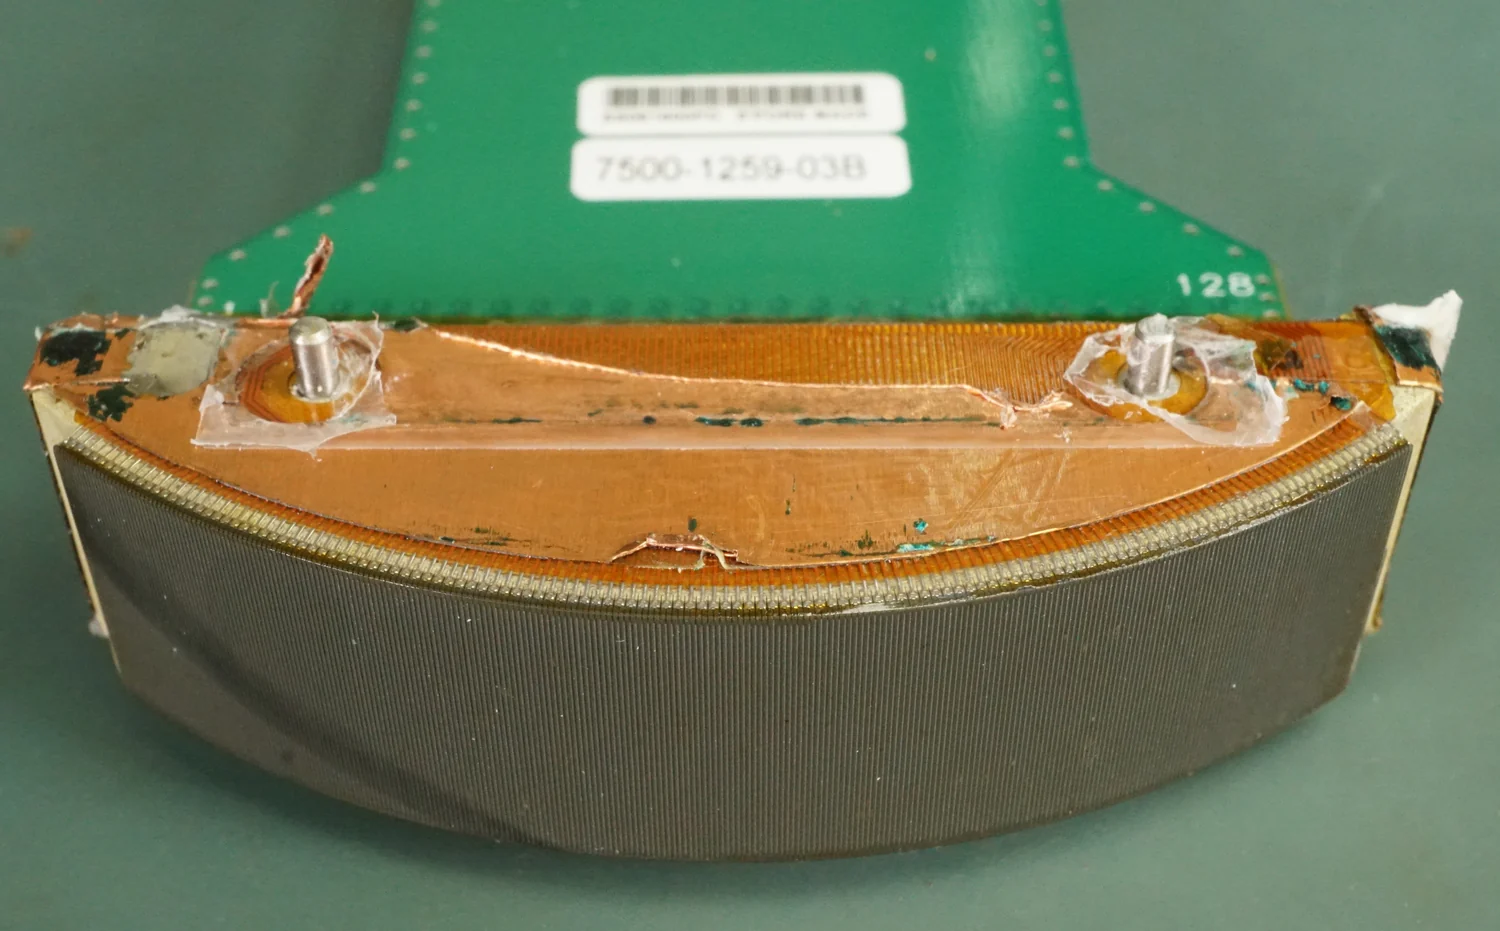
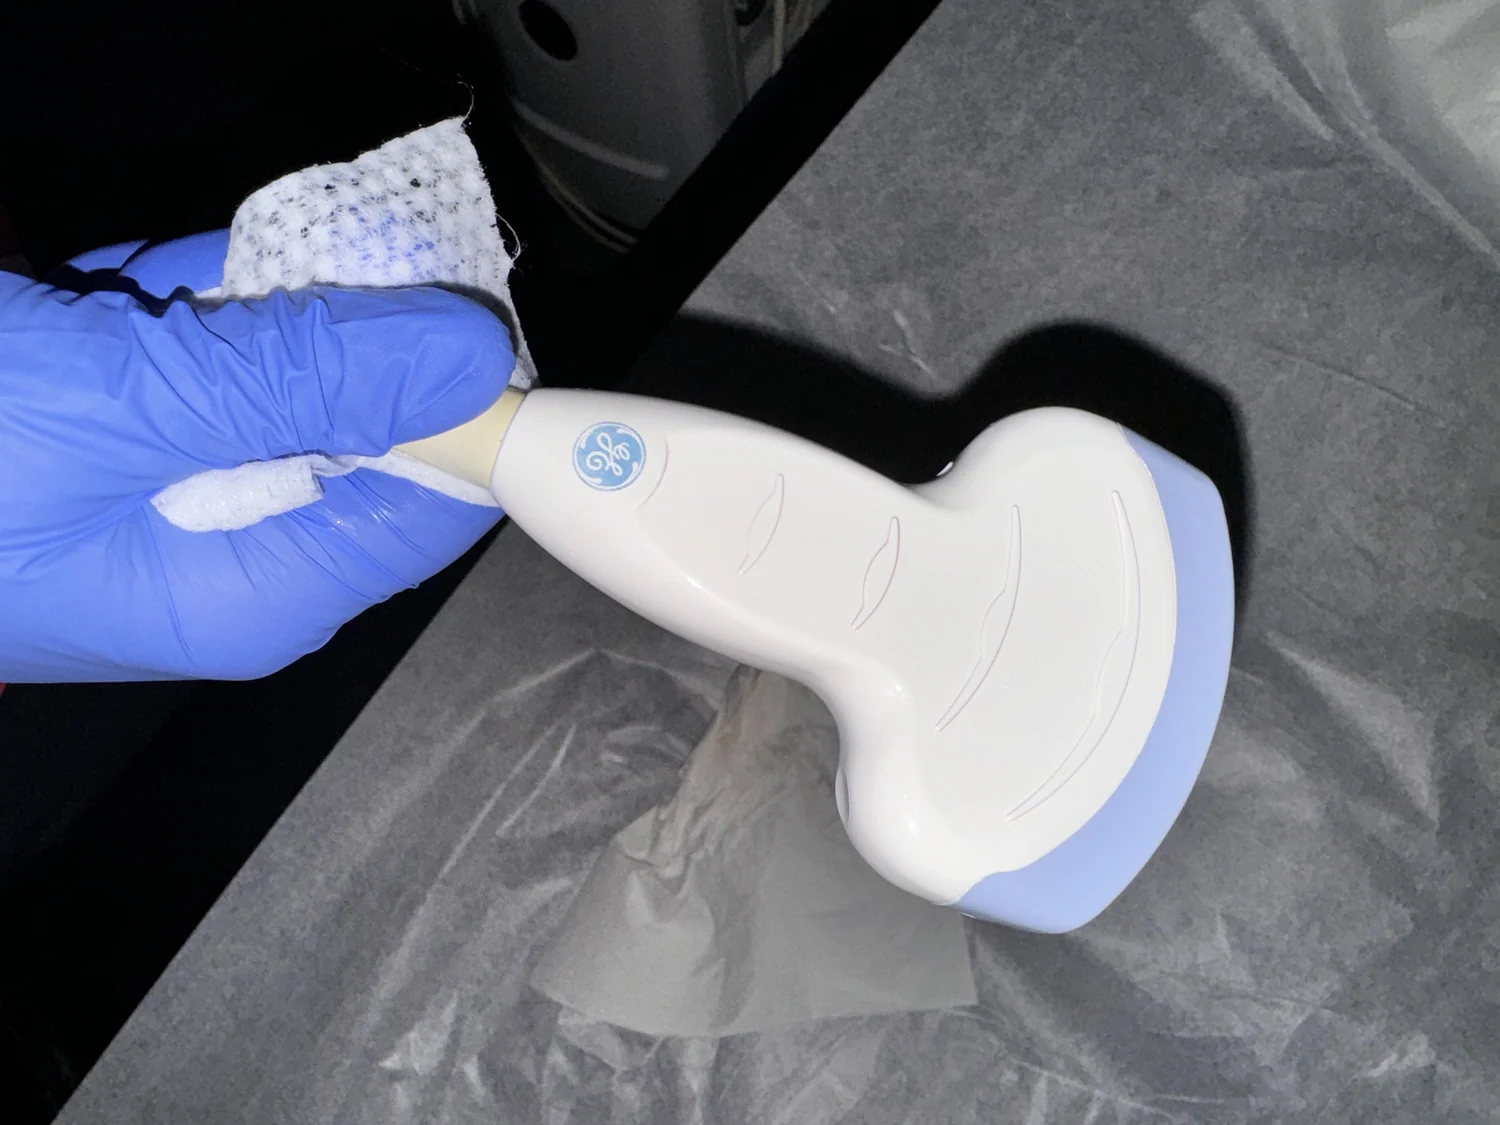
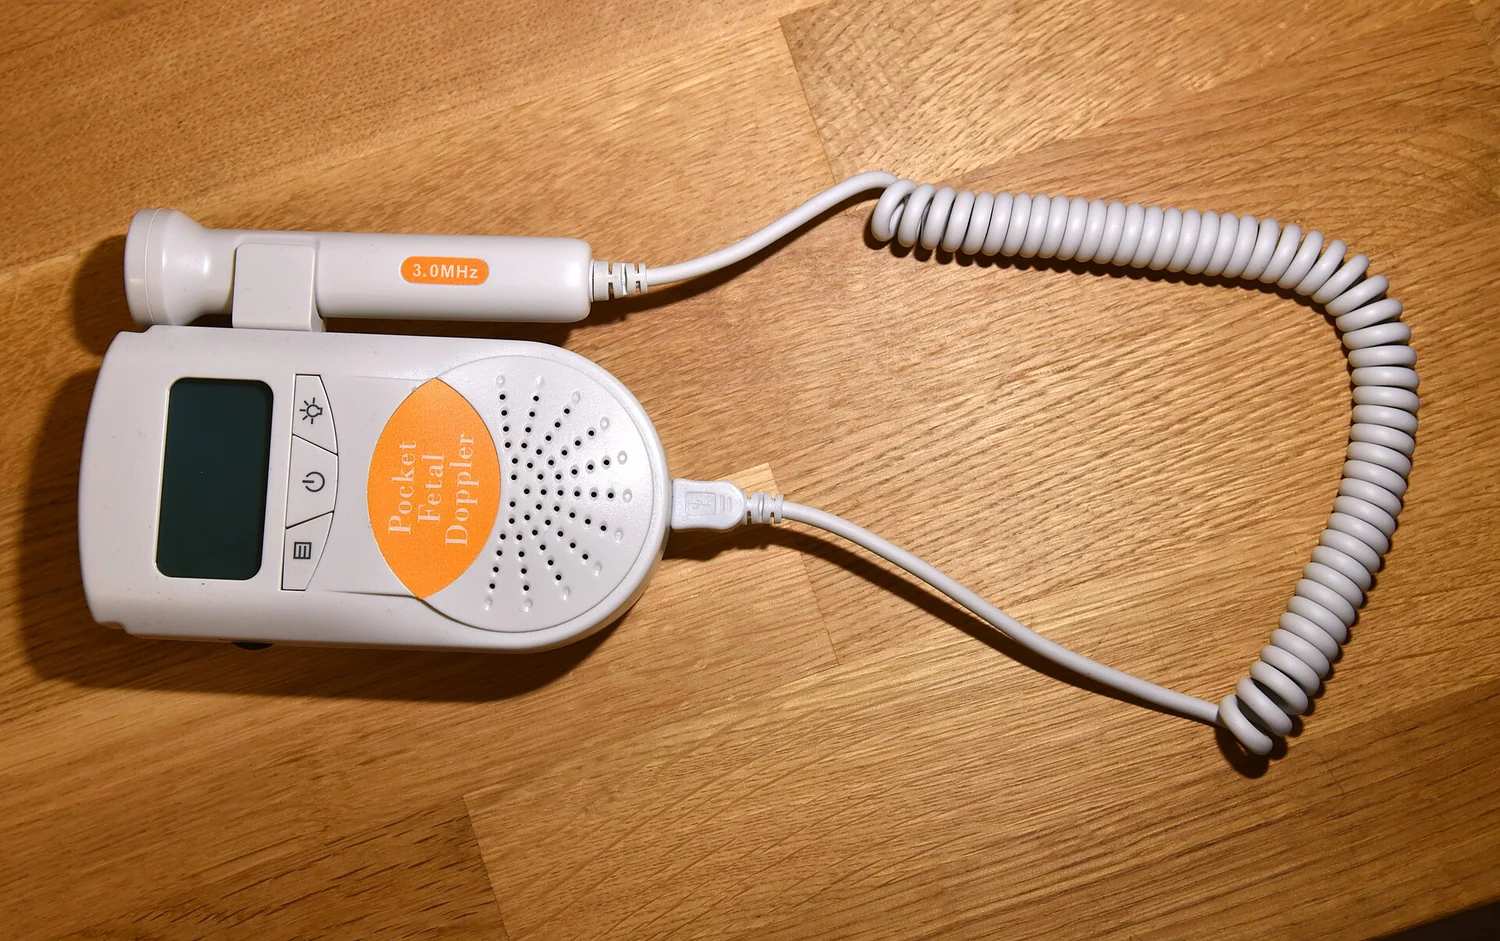
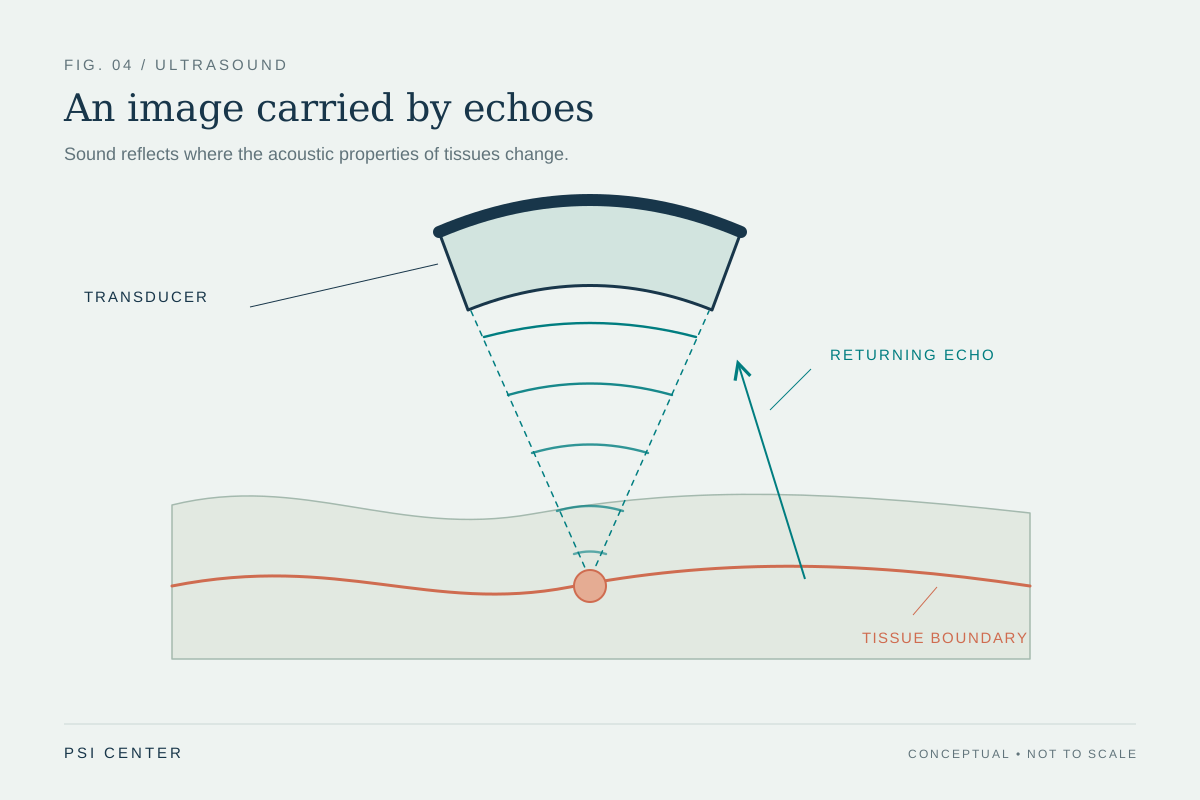
In ultrasound imaging, a transducer sends sound into the body and detects echoes returning from boundaries between tissues. The scanner uses the echo’s travel time to estimate depth. Elastography builds on the same general idea of sending and detecting sound, but focuses on how tissue shifts or deforms as a wave passes. The pattern of motion provides information about relative softness or hardness [2].
A useful mental picture is a stadium wave moving through two neighboring sections of a crowd. Where people can shift easily, the pattern changes differently than where the crowd is tightly packed. Real tissue is not a crowd, and the method relies on instrument measurements rather than visual judgment, but the analogy captures the central inference: a wave’s response contains information about the material it travels through.
Why MRI can join the measurement
Magnetic resonance elastography, or MRE, combines a mechanical disturbance with MRI. MRI uses strong magnetic fields and radio-frequency pulses to detect signals from protons in the water within tissues. The signal changes according to the protons’ environment, allowing different tissues to be distinguished; MRI does not use ionizing x-rays [1].
For MRE, a device placed over the liver sends sound waves through it before the patient enters the MRI scanner. The scanner detects the wave response and uses it to estimate tissue density and health. The method illustrates how modalities can complement one another: sound supplies the disturbance, while MRI provides a way to observe its passage through the organ [1].
A clue, not a verdict
Stiffness maps can help assess liver fibrosis, in which scar tissue builds up after inflammation. They may also help distinguish a suspicious region from surrounding tissue. But a map is still an indirect measurement: it reports mechanical behavior, not the full biological cause of that behavior. Interpretation belongs alongside other clinical information.
This distinction matters whenever an image looks precise. A color-coded region is not automatically a diagnosis, and a promising use does not mean every patient can avoid biopsy or other tests. Elastography’s strength is that it makes a hidden physical property visible without cutting into tissue. Its limits follow from the same fact: a measurement of response must be interpreted in context.
Explore the physics: an explanatory diagram
Sources & further reading
- Magnetic Resonance Imaging NIBIB
- Ultrasound NIBIB
Prepared for the independent PSI Center reading library. About edition dates and source checking.
This explainer describes scientific principles. It does not assess individual treatment choices.