How can a sound meter describe both a quiet room and a thunderous concert without using an unwieldy list of zeros? It uses decibels, a logarithmic scale that compares sound intensity with a reference level. The scale is useful precisely because hearing spans an enormous range, but it can mislead: a change of a few decibels is not a change of just a few percent. The underlying pressure and energy change multiplicatively, while the printed number changes additively.
Why sound needs a compressed scale
A sound wave is a pattern of pressure fluctuations traveling through a medium such as air. A microphone can measure those fluctuations, but their range is huge: a faint sound and an intense one differ by many orders of magnitude. A logarithm turns multiplication into addition, allowing a compact scale to represent that range.
Decibels express a ratio rather than an absolute amount. For sound intensity, a change of 10 decibels corresponds to a tenfold change in intensity. For sound pressure, the relationship uses 20 times the base-ten logarithm of the pressure ratio, because intensity is proportional to pressure squared under comparable conditions. The number therefore depends on what is being compared and on the chosen reference.
What a few decibels mean
Imagine turning up a steady tone while watching a meter. A rise of 3 dB represents roughly twice the sound intensity, although the ear does not perceive loudness as a simple intensity meter would. A rise of 10 dB means ten times the intensity, and is often perceived as substantially louder. The decibel number adds; the physical quantity multiplies.
Everyday sound ratings often use A-weighted decibels, written dBA. This weighting adjusts measurements to reflect the ear’s varying sensitivity to frequencies. It is useful for comparing environmental noise, but it does not mean every sound at the same dBA has the same character or subjective loudness. NIDCD gives normal conversation as roughly 60–70 dBA, while concerts and music at maximum headphone volume may be much higher [1].
The ear is a mechanical-to-electrical chain
Sound pressure moves the eardrum, and three tiny middle-ear bones pass those vibrations to fluid in the cochlea. There, a traveling wave moves the basilar membrane. Hair cells ride that motion; tiny projections on them bend, opening channels that produce electrical signals. The auditory nerve carries those signals to the brain, where they become recognized sound [2].
This chain clarifies why exposure is about more than a meter reading. A very intense impulse can damage the ear quickly; a less intense sound repeated for long periods can also harm the delicate sensory structures. NIDCD notes that sounds at or below 70 dBA are unlikely to cause hearing loss even with long exposure, while long or repeated exposure at or above 85 dBA can cause damage; louder sound shortens the time needed [1].
Reading exposure as a dose in time
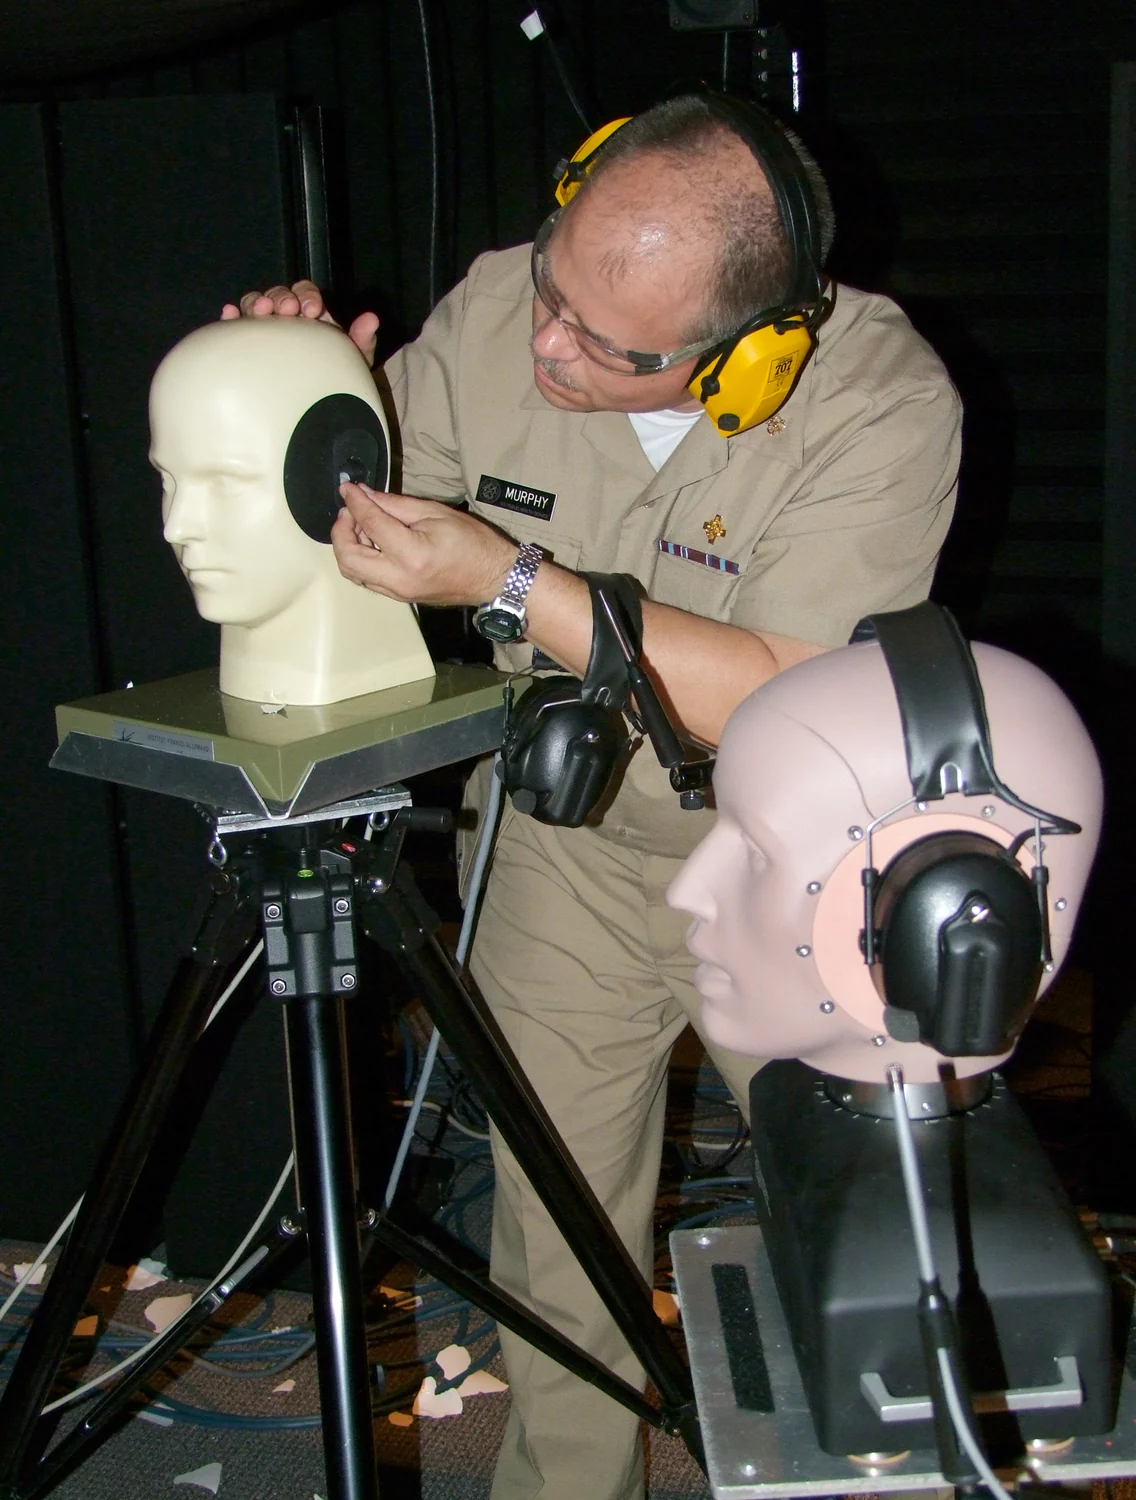
Consider two listeners near the same speaker. One hears a brief passage; the other remains there for hours. Their instantaneous sound levels may match, but their total exposure does not. Distance matters too: moving away from a source generally reduces the sound reaching the ear, while protective devices reduce the pressure transmitted into it. This is why guidance groups loudness with duration and proximity rather than treating one decibel value as a complete prediction.
Decibels make sound comparisons manageable, not automatic. A single rating cannot capture every frequency, listening condition, or individual response. Nor does temporary muffling after loud sound guarantee that the ear has escaped lasting effects; NIDCD notes evidence that residual damage may remain even when temporary hearing loss seems to resolve. The scale is best read as a compact physical comparison, paired with attention to how loud, how close, and how long.
Sources & further reading
- Noise-Induced Hearing Loss NIDCD
- How Do We Hear? NIDCD
Prepared for the independent PSI Center reading library. About edition dates and source checking.
This explainer describes scientific principles. It does not assess individual treatment choices.