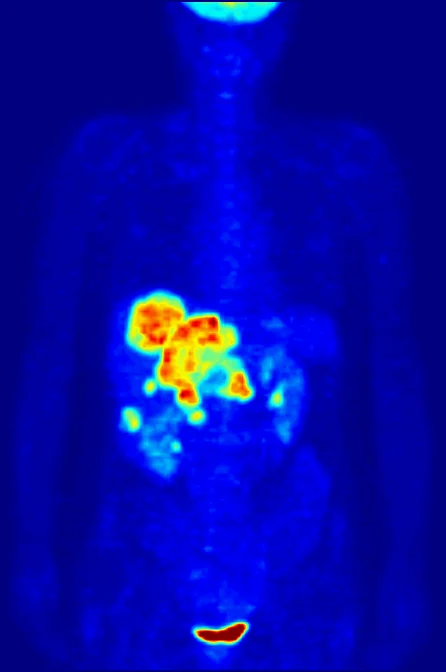
A PET report may attach a number to a region that looks bright, but that number is not a tally of tumor cells. For the common tracer fluorodeoxyglucose (FDG), a standardized uptake value (SUV) scales measured tracer concentration against the injected activity and a body-size measure. It is a convenient semiquantitative index of tracer distribution under a defined scan protocol—not a direct count of cells, a universal measure of cancer aggressiveness, or a diagnosis by itself. [1]
From decays to a normalized number
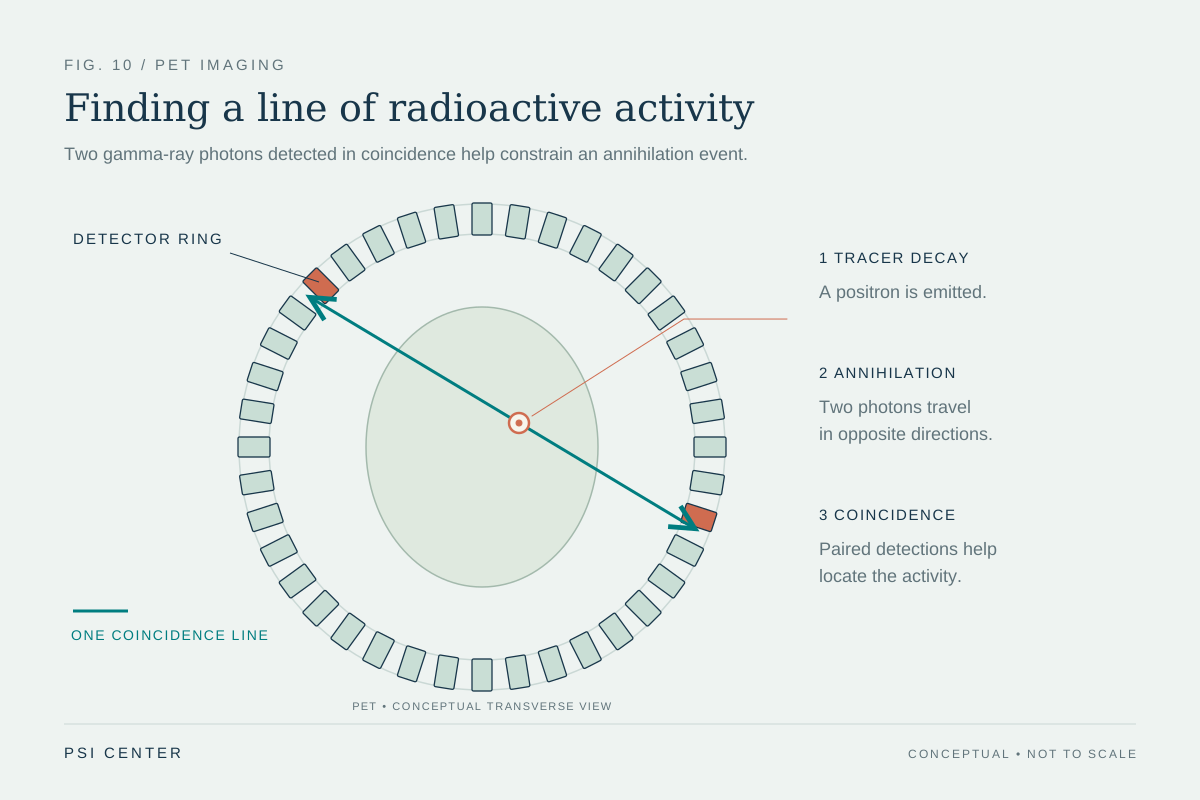
PET detects pairs of gamma rays produced after a positron-emitting tracer decays. With FDG, the tracer resembles glucose and enters cells through glucose transporters; its distribution is reconstructed as activity concentration. An SUV divides that concentration by the injected activity normalized to a chosen body measure, commonly total body mass. In a simplified form, SUV = tissue activity concentration ÷ (injected activity / body mass). This scaling makes values easier to compare than raw counts alone, but the result still depends on how the scan and calculation were performed. [1]
The “standardized” in SUV can sound stronger than it is. The number is not a direct laboratory assay of glucose consumption or a cell census. It is a ratio built from a reconstructed image, a tracer dose, and normalization choices. The EANM guideline calls SUV the most commonly used semiquantitative parameter and emphasizes quality control and harmonization because reproducibility across scanners and sites matters. [1]
A worked example of normalization
Imagine two scans report the same reconstructed activity concentration in a small region. If the injected activity or the body-size denominator differs, the calculated SUV can differ even though the regional concentration is identical. Conversely, equal SUVs do not mean equal numbers of cells: the ratio compresses several measurements into one normalized value and says nothing by itself about how many cells contributed to the signal.
This is why the measurement recipe matters. A useful comparison records what tracer was used, how much was administered, when imaging began after injection, the patient preparation and blood glucose context, scanner calibration, reconstruction, and the exact uptake metric. The EANM guidance describes standardization of acquisition and quality assurance as prerequisites for meaningful quantitative comparisons. [1]
The hottest pixel is a fragile summary
SUV can refer to several different summaries. SUVmax is the value of the single hottest image voxel. A single voxel is sensitive to image noise and to differences in scanner resolution, voxel size, filtering, and reconstruction. PERCIST therefore proposed a peak measure averaged within a small, fixed volume around a lesion’s hottest focus, with uptake normalized to lean body mass (SULpeak). Averaging a region reduces dependence on one noisy pixel, though it does not eliminate biological or technical uncertainty. [2]
Even a more stable metric is not interchangeable with every other SUV. A paper reporting SUVmax and another reporting SULpeak are not necessarily measuring the same quantity. Thresholds developed for one definition and protocol cannot simply be applied to another as if the labels were identical. PERCIST was presented as a framework for consistent response assessment and as a starting point requiring further validation across diseases and treatments. [2]
Tracer uptake is biology plus context
FDG uptake reflects glucose-like tracer handling, not a cancer-specific switch. Activated inflammatory cells and some normal tissues can also accumulate FDG. Blood glucose and insulin, recent activity, uptake time, lesion size, partial-volume effects, and treatment-related inflammation can affect what appears in an image or how a region is quantified. The EANM procedure guidance discusses patient preparation and glucose measurement because these conditions can influence the distribution being measured. [1]
A high value therefore does not, on its own, establish malignancy or severity, and a low value cannot rule out disease in every setting. Interpretation uses the pattern, anatomy, tracer, clinical question, prior imaging, and other evidence. PET’s functional signal complements other measurements; it does not replace them.
Comparisons need a defined question
A before-and-after comparison asks whether the measured tracer signal changed under comparable conditions. That is narrower than asking whether a tumor’s cell count changed, whether a treatment worked for a person, or whether survival will improve. PERCIST was designed to make response comparisons more structured, including use of a defined peak region and reference tissue, but its authors explicitly described the criteria as a framework needing refinement and validation. [2]
The practical reading rule is simple: ask which SUV variant is reported, how the scans were standardized, and what conclusion the metric is intended to support. A numerical uptake value can make PET evidence more reproducible and comparable. Its meaning remains tied to its definition and context; it is not a cell count.
Explore the physics: an explanatory diagram
Sources & further reading
- FDG PET/CT: EANM procedure guidelines for tumour imaging: version 2.0 European Journal of Nuclear Medicine and Molecular Imaging (2015)
- From RECIST to PERCIST: Evolving Considerations for PET Response Criteria in Solid Tumors Journal of Nuclear Medicine (2009)
Sources checked: 6 November 2026. The calculations illustrate physical models; they are not clinical settings.
Prepared for the independent PSI Center reading library. About edition dates and source checking.
This explainer describes scientific principles. It does not assess individual treatment choices.