A conventional CT image mainly shows how strongly tissues attenuate X-rays. Spectral photon-counting CT can sort detected photons by energy, making it possible to estimate which materials contributed to the signal. A 12 October 2026 phantom study tested whether this “color K-edge” approach could separate eight candidate elements in a lung-shaped model. The result is a promising measurement experiment, with an important boundary: a phantom is not a breathing patient, and detectability is not the same as useful diagnosis.
The energy signature behind a material map
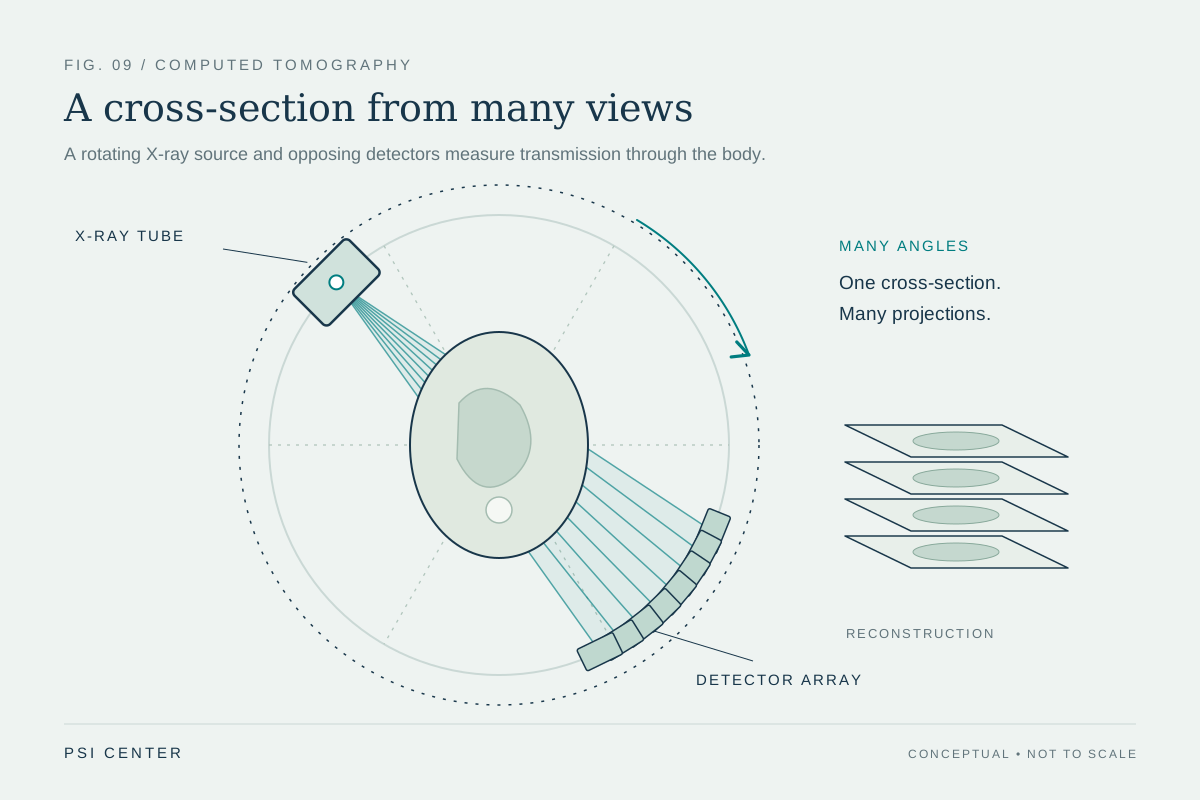
CT reconstructs cross-sectional images from X-rays that pass through the body at many angles. A contrast material becomes visible because its atoms change X-ray attenuation. In energy-integrating detectors, the detector combines the energy deposited by many photons into a signal. Photon-counting detectors register individual X-ray interactions and sort them into energy ranges. This energy information gives reconstruction algorithms more ways to estimate the materials in a voxel, although the result still depends on calibration, noise, and the assumptions used in decomposition [2].
Every element has a characteristic K-shell binding energy. Near that energy, the probability that an X-ray photon will be absorbed by an inner-shell electron changes sharply; the feature is called a K-edge. If a scanner samples energies on either side of an element’s edge, a material-decomposition method may identify that element’s contribution amid the combined attenuation from water, tissue, and other substances. “Color” here means material-specific channels or maps, not a literal color photograph and not necessarily a direct view of physiology.
What the October experiment actually put in the scanner
Gutwinska and colleagues tested eight candidate high-atomic-number elements: gadolinium, holmium, ytterbium, hafnium, tantalum, tungsten, gold, and bismuth. They prepared solutions across 12 tubes, from zero to 2 milligrams per milliliter, placed those tubes in an anthropomorphic lung phantom, and scanned them on a clinical spectral photon-counting CT system using lung protocols. Three exposure settings—50, 75, and 150 mAs—let the team examine performance under different photon-count conditions [1].
The comparison is deliberately controlled. The investigators already knew what concentration was in each tube, so they could compare measured concentration against prepared concentration and calculate relative percentage error. They also measured noise and contrast-to-noise ratio (CNR), a measure of how visible a signal is relative to image variation. The method asks whether material concentration can be recovered in a model, not whether a radiologist can diagnose a disease from a patient scan.
More visible signal does not settle which agent is best
Across the tested materials, average absolute relative percentage error ranged from 15.9% (with an 8.0 percentage-point spread) for ytterbium to 34.7% (19.0 points) for bismuth. The paper reported that quantification was less accurate for bismuth. Color K-edge images had a mean noise of 0.030 ± 0.007 mg/mL, while conventional images had mean noise of 20.4 ± 2.7 Hounsfield units. These noise values use different measurement scales, so they are not a direct numerical contest. The study’s CNR analysis showed a steeper increase with concentration for color K-edge images than for conventional images [1].
A worked interpretation helps keep the result in scale: if a phantom tube contains a known concentration and a reconstruction estimates it with a 16% relative error, that is evidence that the setup can quantify that element under those conditions. It does not tell us whether a real lung would contain a safe, stable, deliverable amount; whether the signal would distinguish disease from normal variation; or whether the answer would change clinical decisions. Nor does stronger contrast alone establish a lower radiation dose. The three mAs settings are experimental acquisition choices, not a tested patient protocol.
The missing steps between phantom and patient
The phantom is useful precisely because it removes many uncontrolled variables. It does not reproduce motion from breathing, differences in body size, complex lung structure, blood flow, tissue boundaries, or changes in material distribution over time. Its tubes contain prepared solutions; the work does not report administering these candidate elements to people, measuring lung function in patients, detecting disease, or testing health outcomes. A candidate also needs its own evidence on formulation, delivery route, biological behavior, toxicity, and regulatory status before a clinical imaging role could be considered.
Translation would therefore need several separate demonstrations: repeatable quantification across scanners and protocols; stable maps in moving, realistic models; suitable contrast-agent chemistry and safety evidence; and studies showing that the measurement answers a defined clinical question. Each stage can fail even when the preceding physics works. The authors disclose that one co-author is employed by the scanner manufacturer, while stating that he did not control the data; that relationship is relevant context for evaluating a manufacturer-system study [1].
A useful technical result, with a narrow claim
The study adds a set of candidate materials and concentration measurements to the investigation of color K-edge imaging. Its strongest contribution is technical feasibility in a lung-shaped phantom: spectral information can make selected high-Z elements more distinguishable and quantifiable than ordinary attenuation images under the tested conditions. That is a worthwhile step for imaging physics. It is not evidence that a new lung examination is ready for routine care, that any tested agent is approved for such use, or that a patient would benefit.
When reading future reports, ask what object was scanned, what was known in advance, how error was measured, and whether the endpoint was image quality, a biological measurement, diagnostic accuracy, or patient outcome. Those are related questions, but they form a ladder of evidence. This paper occupies an early rung: a carefully specified material-measurement experiment that motivates further preclinical work.
Explore the physics: an explanatory diagram
Sources & further reading
Sources checked: 3 November 2026. The calculations illustrate physical models; they are not clinical settings.
Prepared for the independent PSI Center reading library. About edition dates and source checking.
This explainer describes scientific principles. It does not assess individual treatment choices.