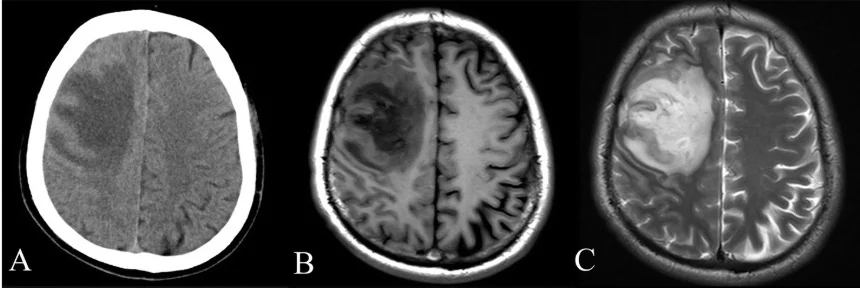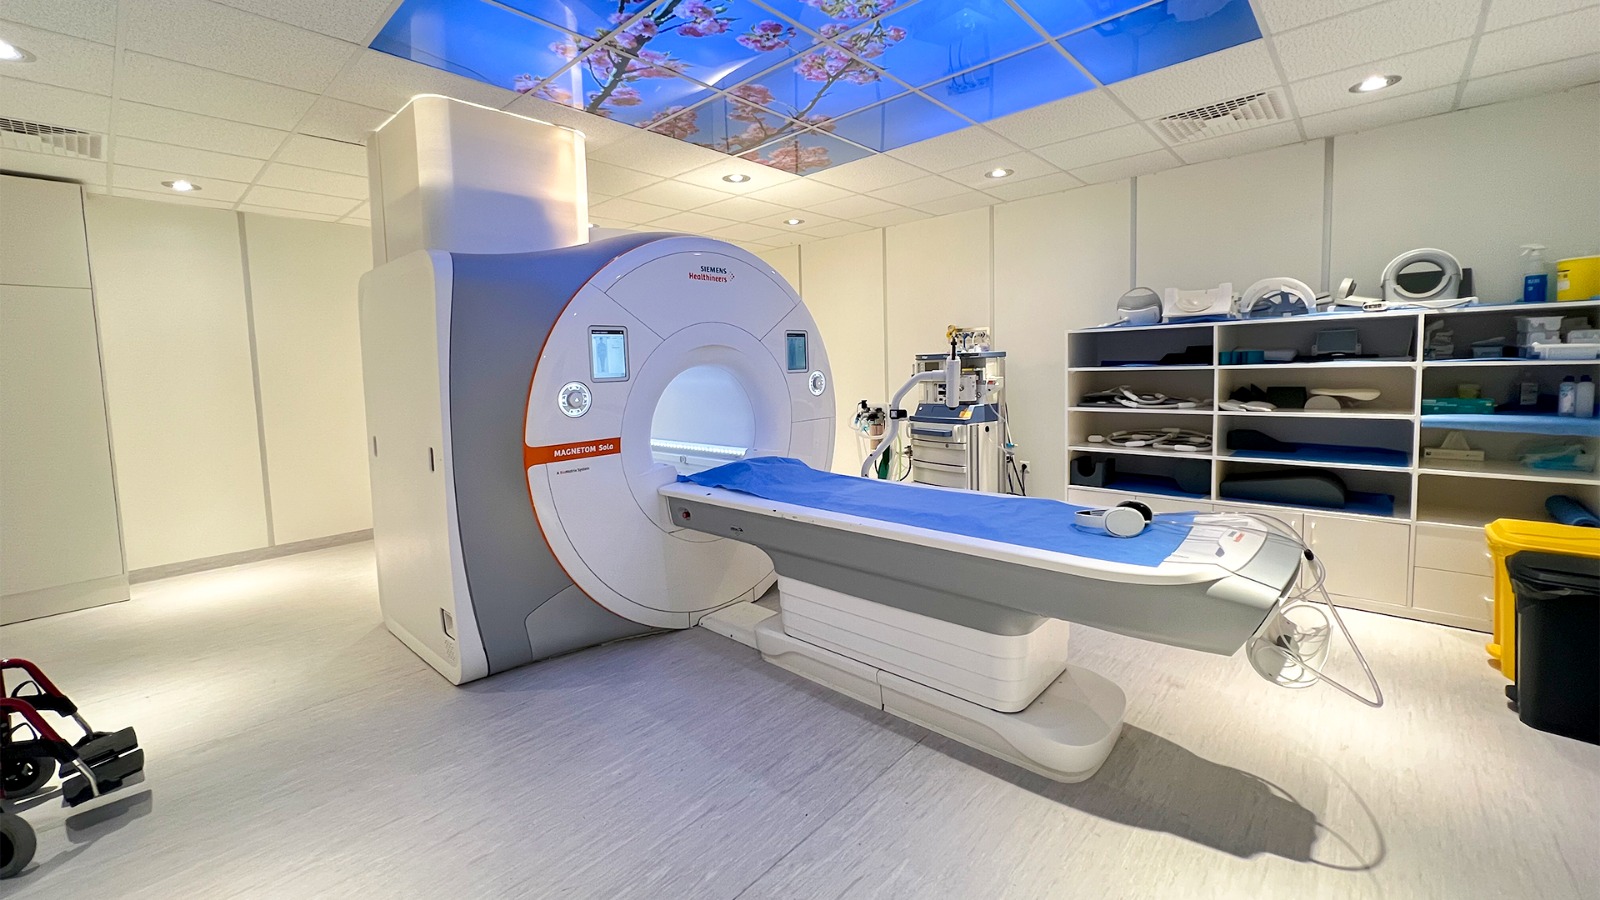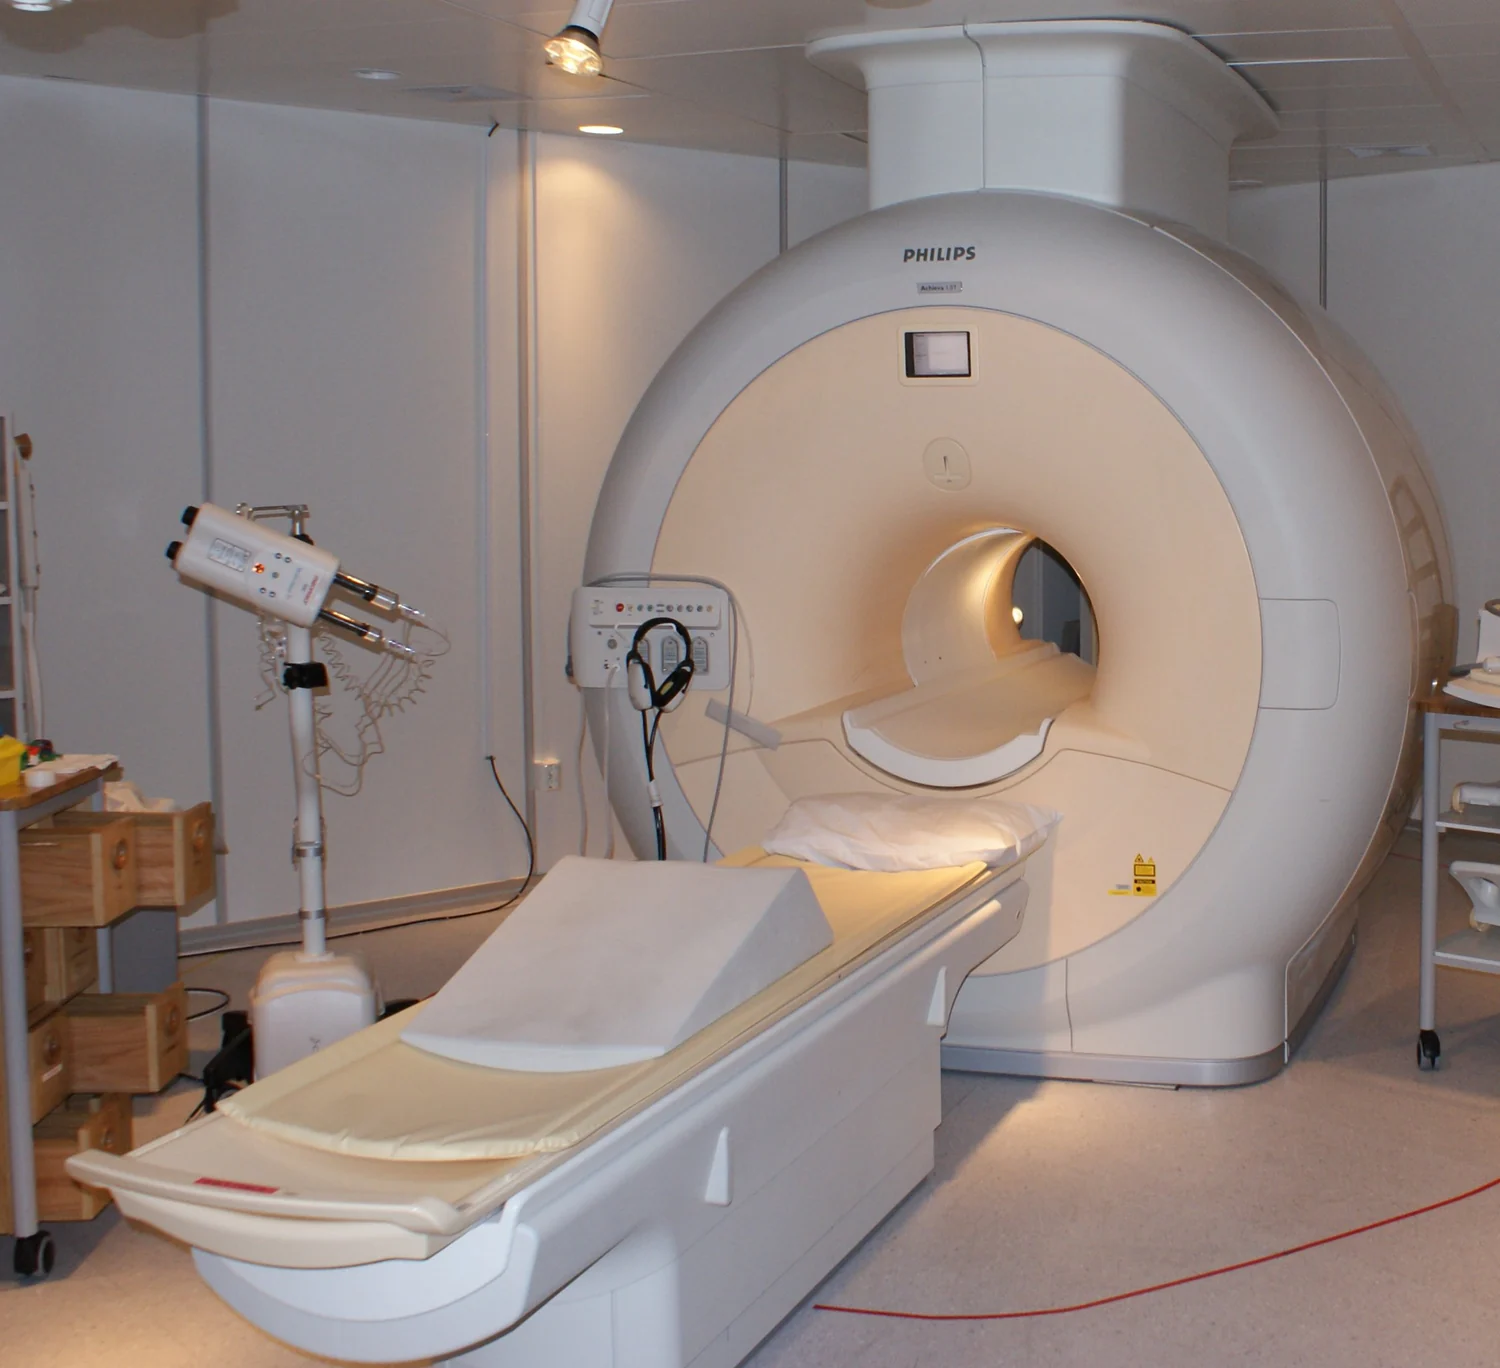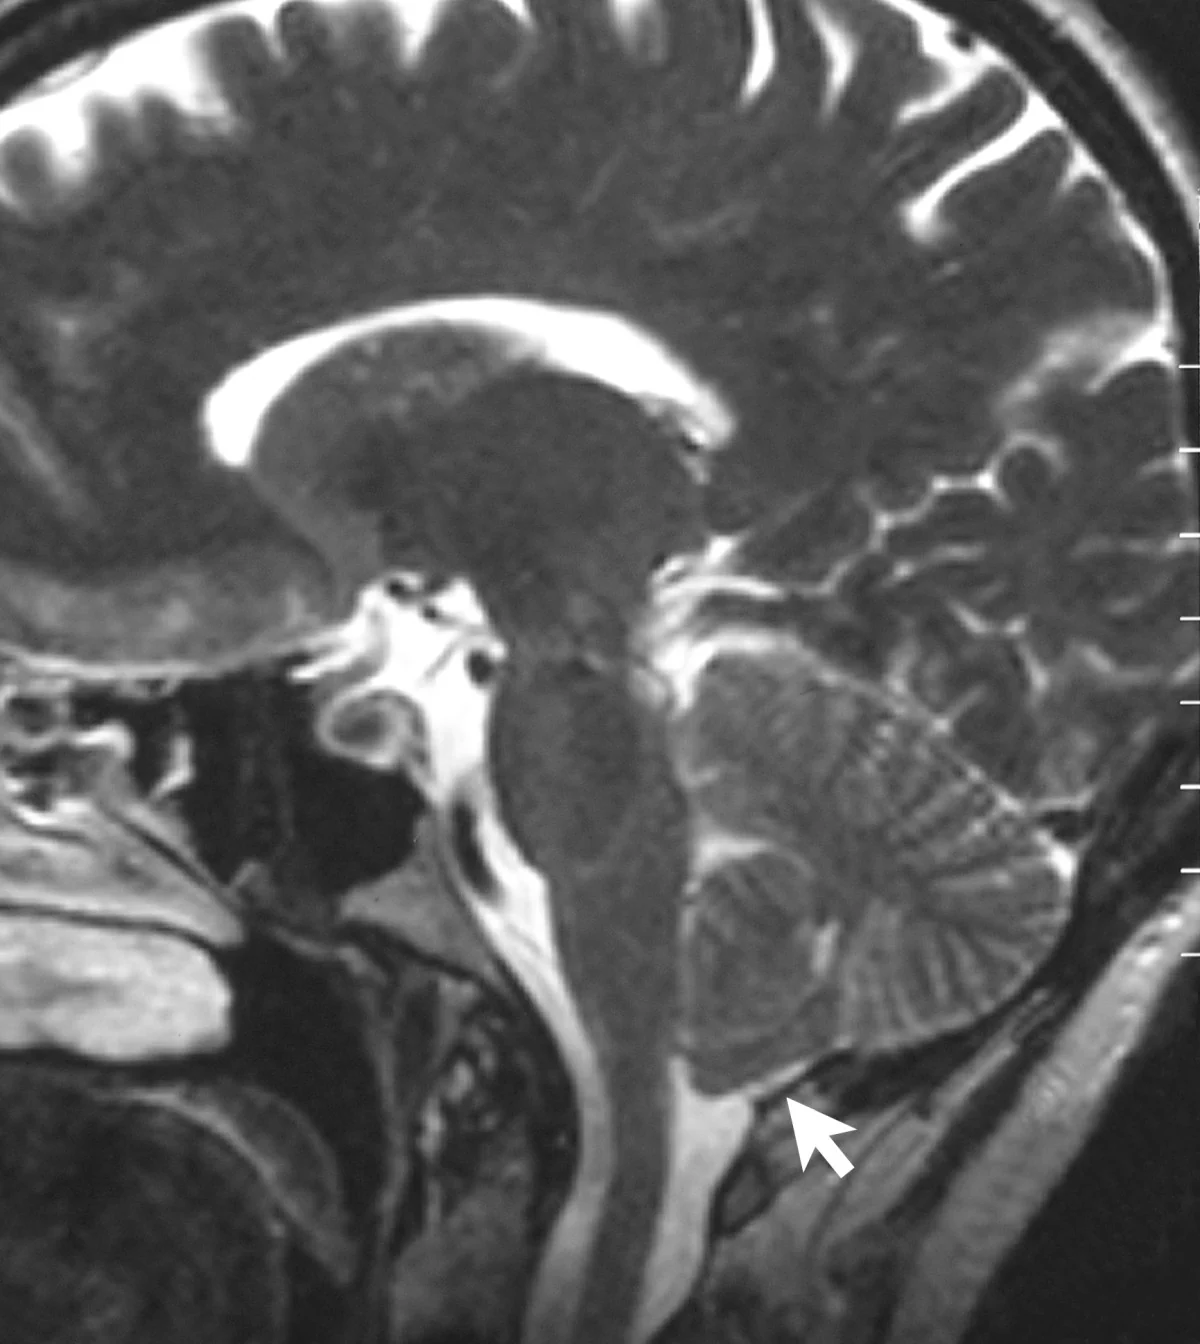
The hypothalamus is small, deep in the brain, and made up of neighboring nuclei that can be difficult to distinguish in ordinary images. A study published online on 6 November 2026 used 17.2-tesla MRI to build a high-resolution mouse atlas and compare structural, functional, and neurochemical measurements. The work is preclinical: it provides a research resource and does not establish a human diagnostic method or treatment. [1]
Why a small deep structure challenges MRI
The hypothalamus sits near the base of the brain and contains many small nuclei with different connections and roles. If an image voxel covers several neighboring structures, their signals are averaged together. The result may outline the region while leaving its internal boundaries indistinct. The authors of a study published online on 6 November 2026 used ultra-high-field MRI to improve that anatomical view in mice. Their work is a research method and shared atlas, not a test of a treatment or a diagnostic scan in people. [1]
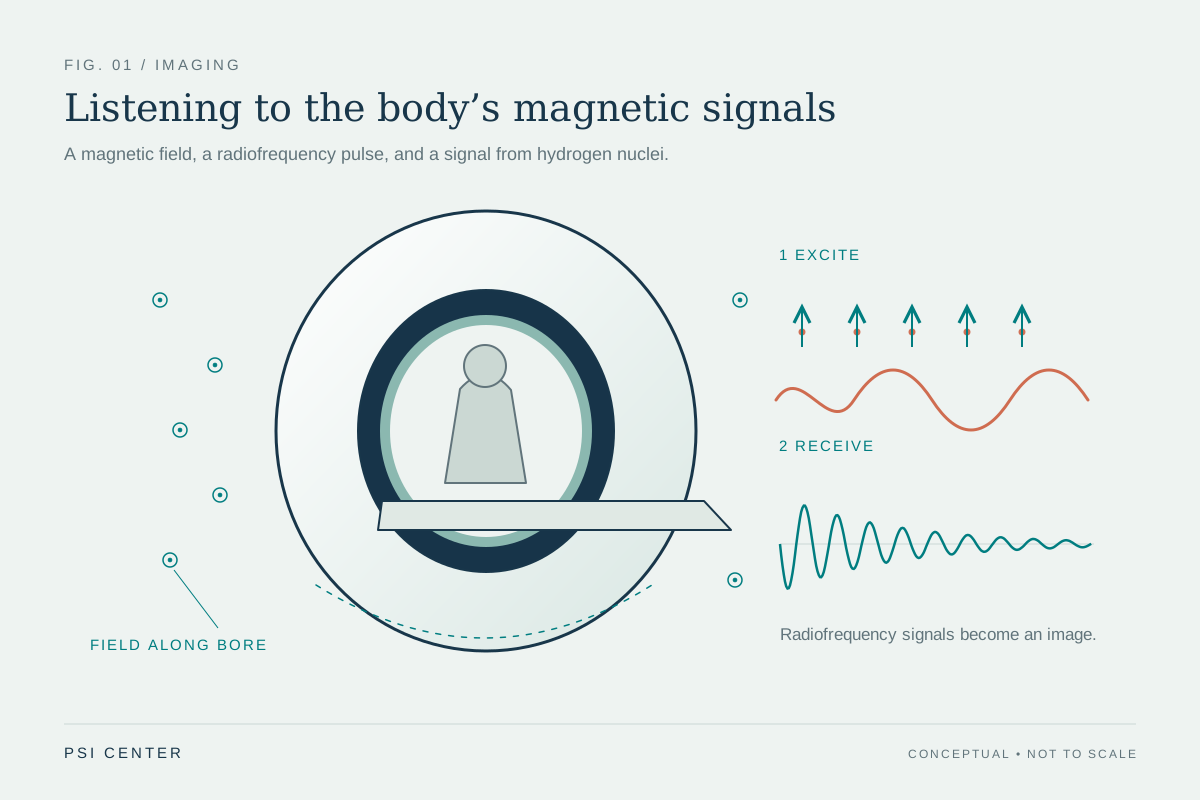
MRI detects signals from hydrogen nuclei, especially those in water, after radiofrequency energy perturbs their alignment in a strong magnetic field. The returning signal depends on the local molecular environment, which helps distinguish tissues. Spatial encoding and reconstruction turn those signals into voxels; smaller voxels can separate finer structures, but generally require enough signal and careful acquisition. That basic signal chain helps explain why a higher-field research instrument can make tiny anatomy easier to study, without implying that field strength alone guarantees a useful image. [2] [1]
A 40-micrometre atlas built from anatomy
For the anatomical template, the team averaged twelve three-dimensional T₂-weighted scans of mouse brains acquired ex vivo at 17.2 tesla. The resulting image grid had isotropic 40-micrometre voxels: each voxel was 40 micrometres along all three axes. Researchers then manually outlined 24 hypothalamic nuclei using visible landmarks and anatomical references, integrating the segmentations into a broader mouse-brain MRI atlas. The resulting HypoAtlas offers researchers a common map for asking where a signal or tract lies. [1]
A voxel is a volume element, not a cell. Forty micrometres is fine enough to help distinguish small anatomical regions, but the scan does not show individual neurons or replace microscopy. The authors describe the resolution as approaching histological detail; that is a comparison of scale, not evidence that MRI has the same tissue specificity as a stained section. Treating the atlas as a coordinate framework keeps the claim proportional to what the image measures. [1]
Separate measurements add different kinds of information
The atlas was one layer of a multiparametric study. Diffusion MRI and tractography were used to map structural pathways within and beyond the hypothalamus. Resting-state functional MRI examined correlated signal patterns across regions, while proton magnetic-resonance spectroscopy measured a combined neurochemical profile in a small volume. These are complementary measurements: anatomy locates structures, diffusion gives indirect information about water movement and tissue organization, resting-state signals describe temporal relationships, and spectroscopy estimates chemicals within its sampled volume. None is a direct recording of every cell or synapse. [1]
The distinction between ex vivo and in vivo work matters. The high-resolution atlas template and diffusion measurements used fixed tissue, while the functional scans and spectroscopy were performed in living mice. In one reported spectroscopy voxel spanning both sides of the hypothalamus, the team could resolve serine, a metabolite that earlier measurements had not reliably detected. That is a capability demonstrated under this study’s specific scanner, sequence, and animal conditions; it does not establish the same sensitivity in routine human imaging. [1]
Differences are measurements to investigate, not diagnoses
The researchers reported sex-associated differences in the volumes of some nuclei and in selected diffusion and metabolite measurements, as well as left–right asymmetry for particular structures. The study’s atlas segmentation comparison included seven female and seven male mice. Those results show why a detailed map can reveal variation hidden by treating the hypothalamus as one undivided region. They do not mean every nucleus differs by sex, and the resting-state functional connectivity analysis did not find significant sex differences under the study’s tests. [1]
A useful way to read such findings is to ask what was measured, in which animals, and with which analysis before asking what it might mean biologically. A difference in a regional volume or metabolite estimate is not itself a behavioral explanation, a disease marker, or proof of a mechanism. The authors discuss possible links to hypothalamic function, but those interpretations need follow-up research and independent replication. [1]
What would make the map useful next
A shared atlas can make experiments easier to compare: two studies can refer to the same named nucleus rather than drawing slightly different boundaries each time. It may also help researchers combine structural, functional, and chemical observations when studying circuits in animal models. The authors have made HypoAtlas available through the EBRAINS research infrastructure, giving other teams a resource to inspect and test. Its value will depend on how consistently it fits new datasets, scanners, and cohorts. [1]
A mouse result does not transfer directly to a person. Human hypothalamic structures differ in scale and anatomy, and research at 17.2 tesla uses specialized hardware and protocols. Clinical MRI safety also depends on the full magnetic-resonance environment, including static and changing magnetic fields and radiofrequency energy; a field-strength number by itself is not a safety assessment or a measure of clinical benefit. The current advance is a more detailed research map and a way to combine measurements in mice. It is a foundation for questions, not evidence for a new clinical service. [1] [3]
Explore the physics: an explanatory diagram
Sources & further reading
- A 17.2T MRI atlas and multiparametric exploration of the mouse hypothalamus reveal sexual dimorphism and lateralization Nature Communications (2026), original research
- Magnetic Resonance Imaging NIBIB
- MRI Benefits and Risks FDA
Sources checked: 22 November 2026. The calculations illustrate physical models; they are not clinical settings.
Prepared for the independent PSI Center reading library. About edition dates and source checking.
This explainer describes scientific principles. It does not assess individual treatment choices.