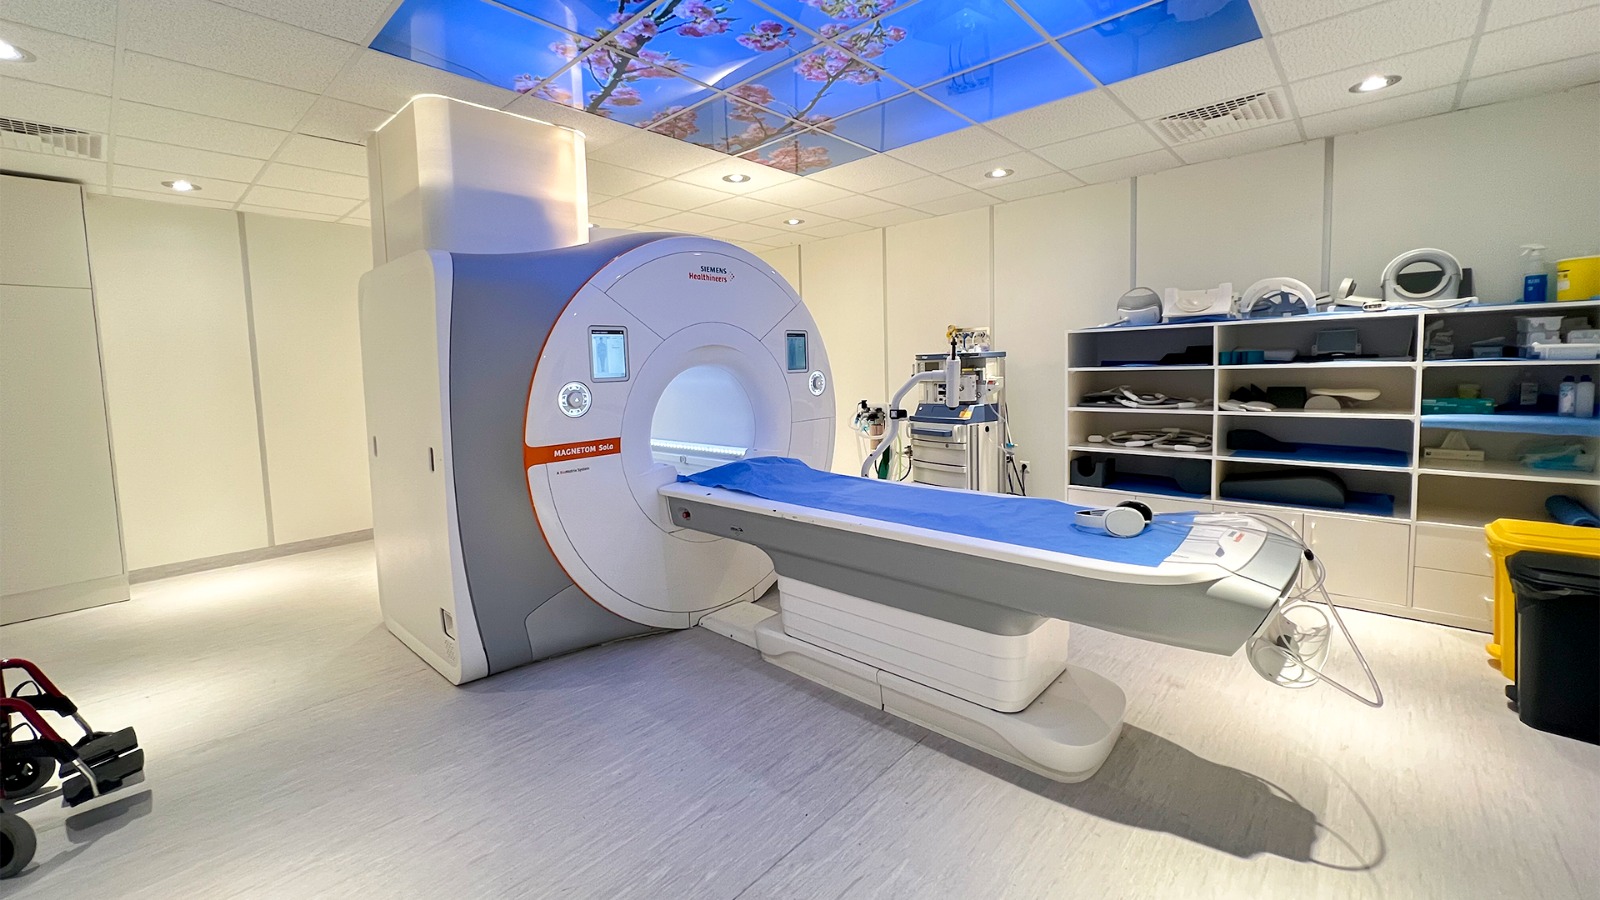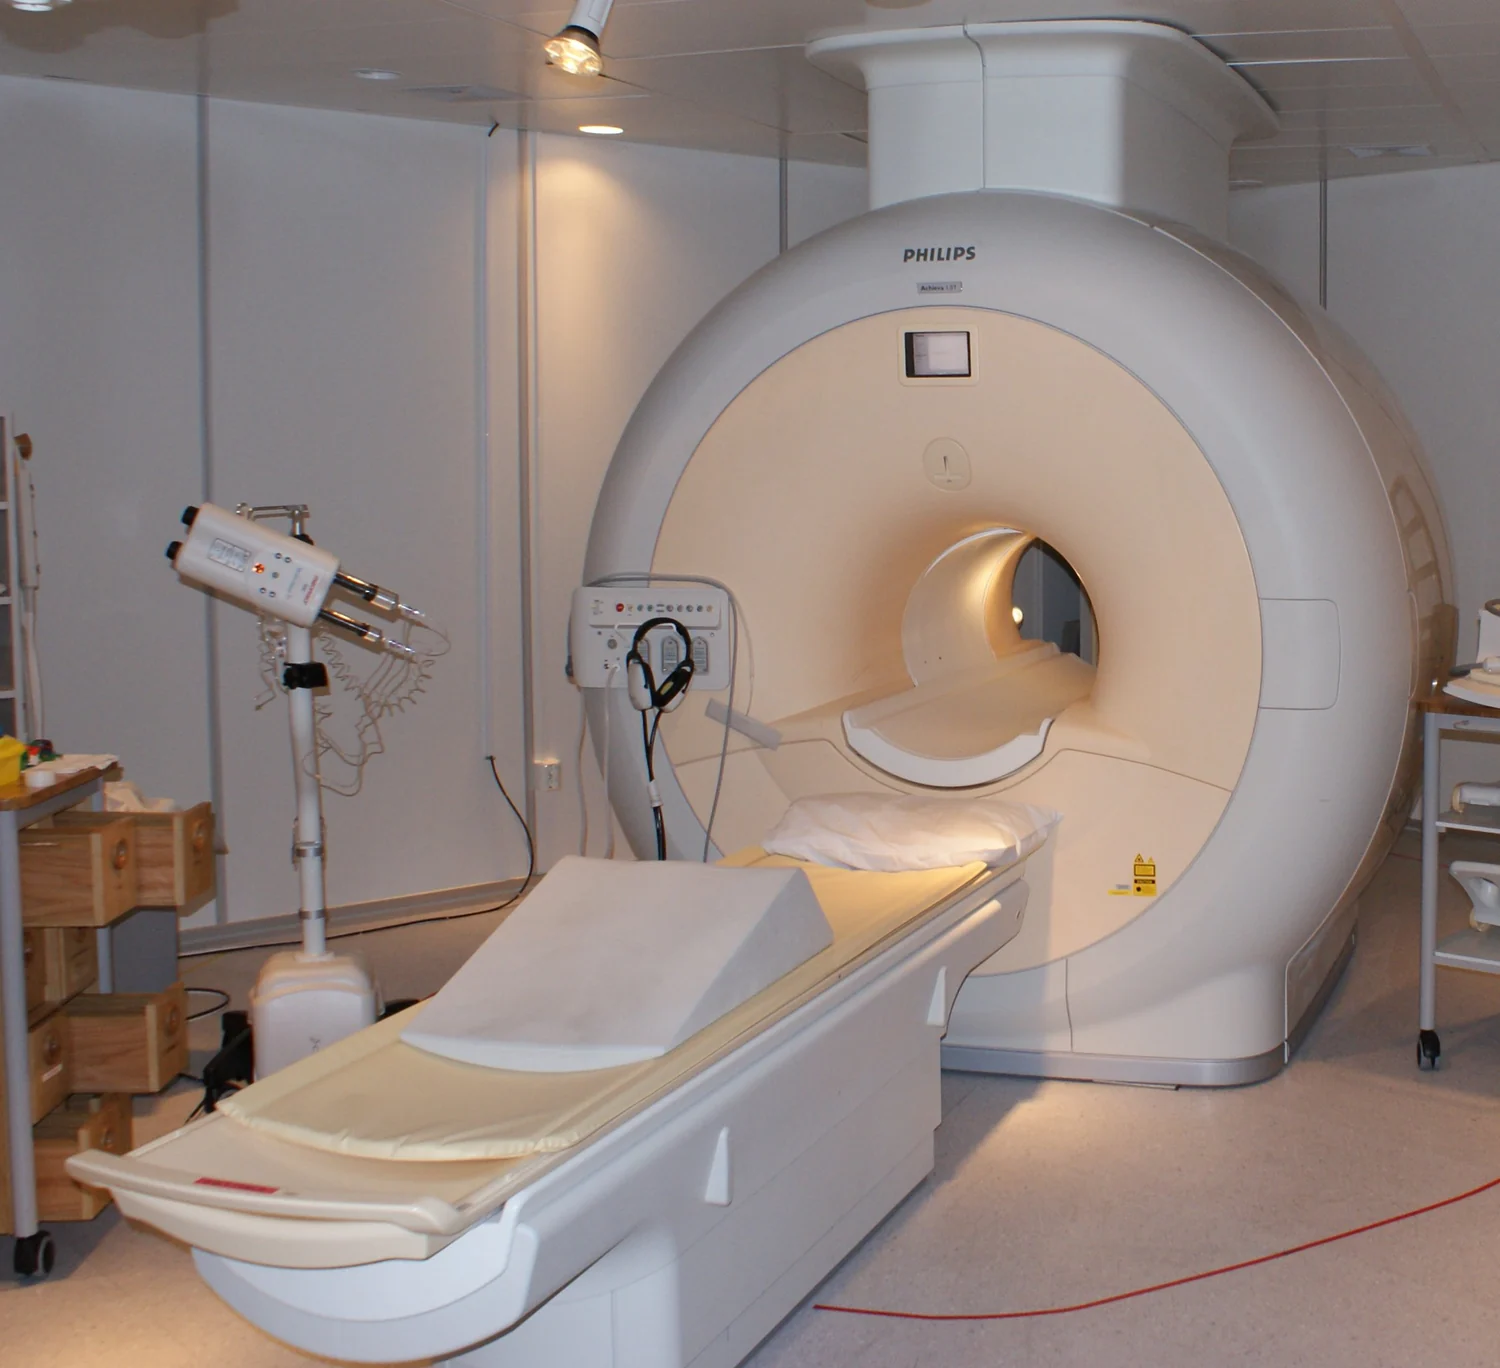
When a brain region becomes active, what exactly changes inside an MRI scanner? The scanner does not photograph thoughts or directly count firing neurons. Functional MRI detects changes in the magnetic properties of blood as oxygen use and blood flow shift during a task. Its oxygen-related signal offers an indirect view of brain function, built from a sequence of biological and physical steps.
From neural work to blood response
Neurons use energy as they communicate. When activity rises in a region, the local demand for oxygen changes, and blood flow responds. The resulting balance between oxygenated and deoxygenated hemoglobin—the oxygen-carrying protein in red blood cells—can shift. Functional MRI, or fMRI, is designed to detect this changing blood oxygenation signal and use it to observe which areas respond during cognitive tasks [1].
The chain is indirect. Neural activity influences metabolism and blood flow; those changes alter the mixture of oxygenated and deoxygenated blood; the mixture affects the MRI signal. A colored patch on an fMRI map therefore indicates a measured signal difference under a particular analysis, not a direct image of a thought or a simple meter of neuron firing.
Why oxygen changes a magnetic signal
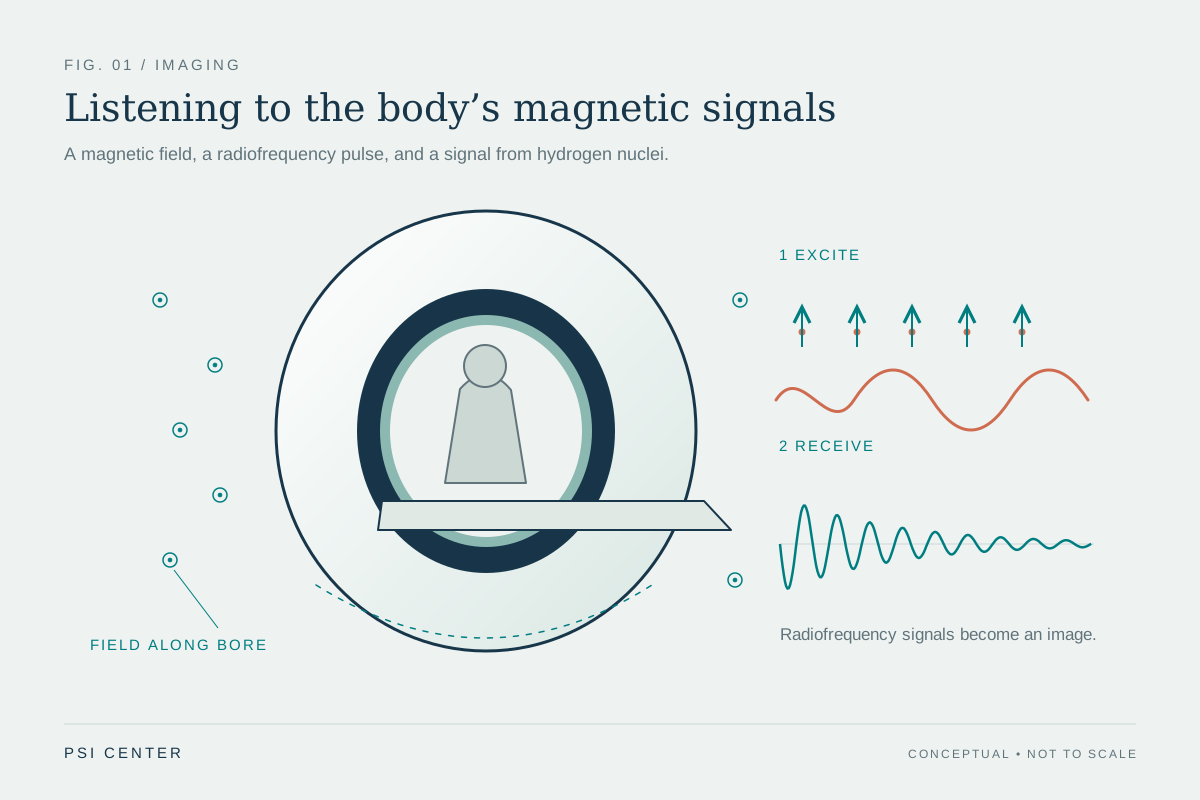
MRI begins with the body’s hydrogen protons, abundant in water. A strong magnetic field partly aligns them. Radiofrequency pulses disturb that alignment; when the pulse ends, the protons return toward their prior state and emit signals that the scanner detects. How quickly the signal changes depends on the local molecular environment [1]. The scanner uses spatial encoding and computation to turn those signals into images.
Deoxygenated hemoglobin has magnetic properties that differ from oxygenated hemoglobin. Those differences influence the local magnetic environment experienced by nearby protons, and thus the signal measured by MRI. The commonly used blood-oxygen-level-dependent signal, often shortened to BOLD, takes advantage of this contrast. It is not a direct oxygen gauge: it reflects a combined response involving blood flow, blood volume, oxygen use, and tissue structure.
A task map is a comparison
Imagine asking a participant to tap a finger in timed intervals while lying still in the scanner. Researchers can compare signal during tapping with signal during rest, repeating the sequence to look for a pattern that tracks the task. The resulting map can show regions whose measured oxygen-related signal differs between conditions. The design of the task and comparison matters: changing the baseline or timing can change which differences stand out.
Computational modeling helps make sense of complex systems by representing variables and testing how they interact [2]. In brain imaging, statistical and computational methods help translate noisy measurements into estimates of task-related patterns. A model can organize evidence and clarify assumptions, but it cannot turn an indirect measure into direct observation. The inferred activity depends on data quality, analysis choices, and the biological link between neural work and blood response.
What the oxygen signal can and cannot say
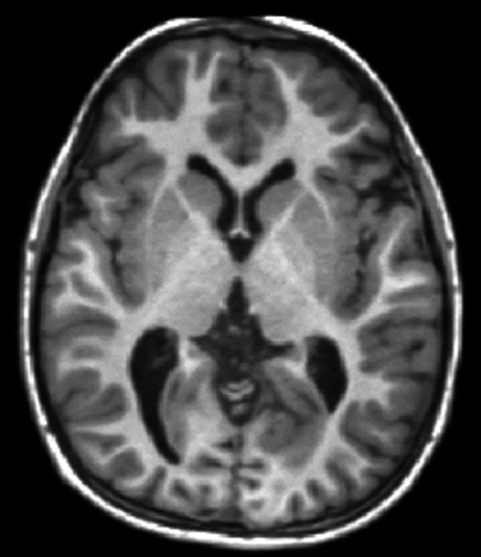
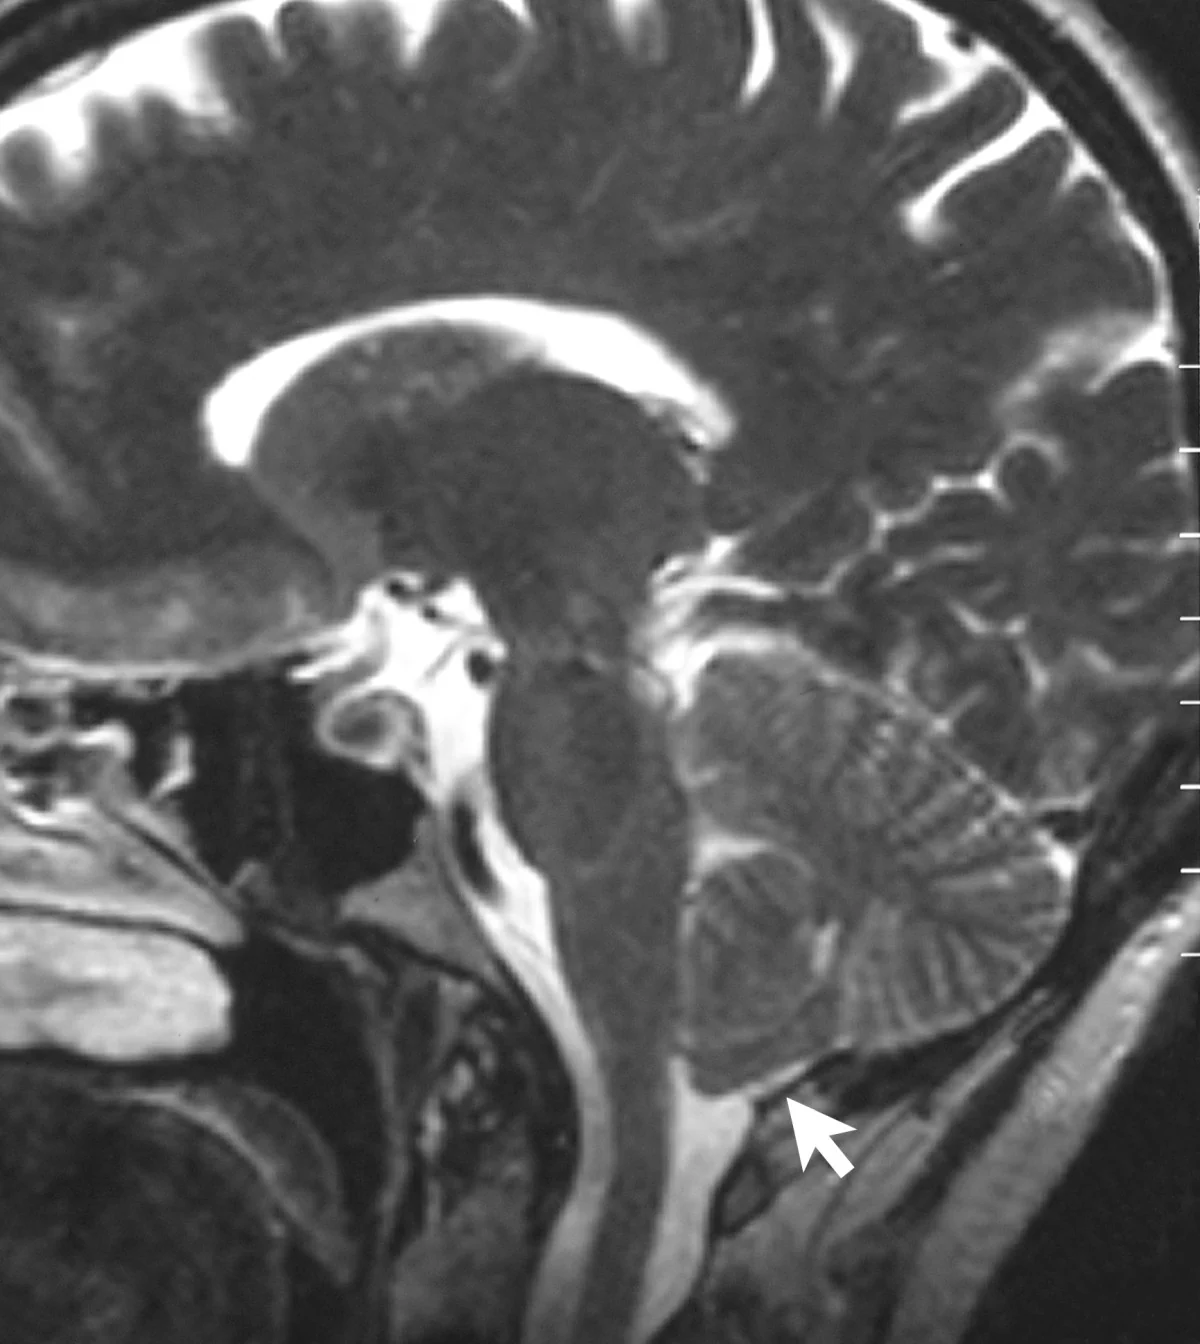
Functional MRI is useful for studying brain organization and for research on how regions respond to tasks. The oxygen-linked signal provides a noninvasive window on changing brain function, while anatomical MRI supplies detailed views of structures. MRI uses magnetic fields and radio waves, not plasma or ionizing x-rays [1]. That distinction matters because the signal’s physical origin is often misunderstood as a form of radiation imaging like CT.
A signal change does not by itself establish that a region is necessary for a task, nor does it reveal the content of a person’s thought. It shows a relationship between a measured blood oxygenation response and an experimental condition. Interpretation becomes stronger when task design, anatomy, and other evidence converge. The most useful mental picture is a chain of causes: neural demand shifts blood chemistry and flow, and those changes alter a magnetic resonance signal that researchers map.
Explore the physics: an explanatory diagram
Sources & further reading
- Magnetic Resonance Imaging NIBIB
- Computational Modeling NIBIB
Prepared for the independent PSI Center reading library. About edition dates and source checking.
This explainer describes scientific principles. It does not assess individual treatment choices.