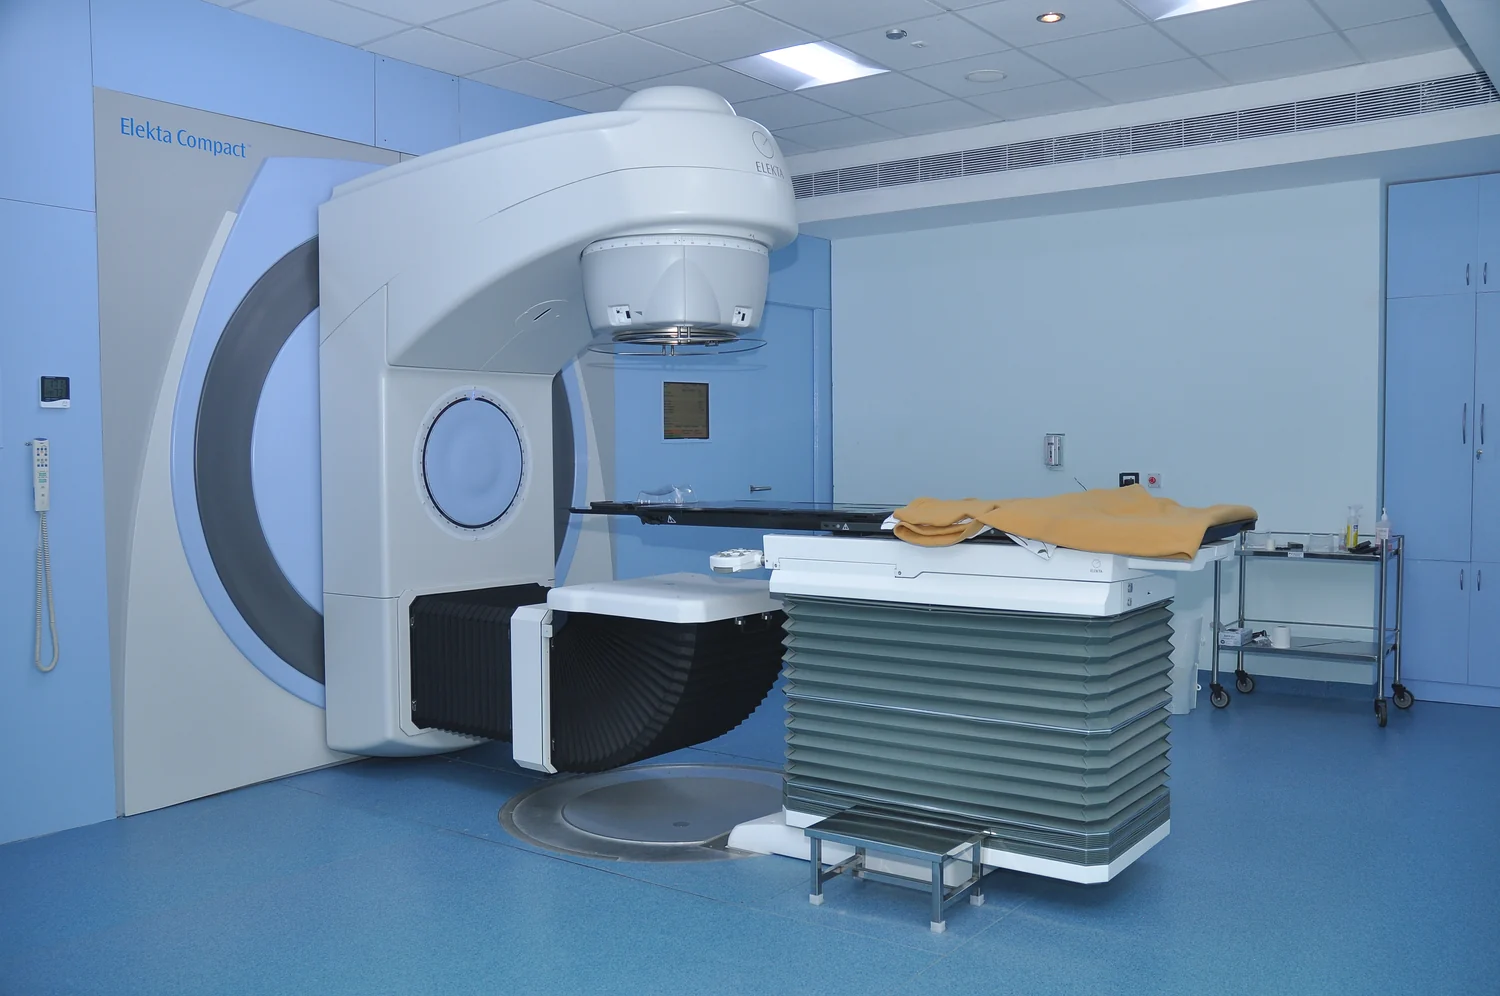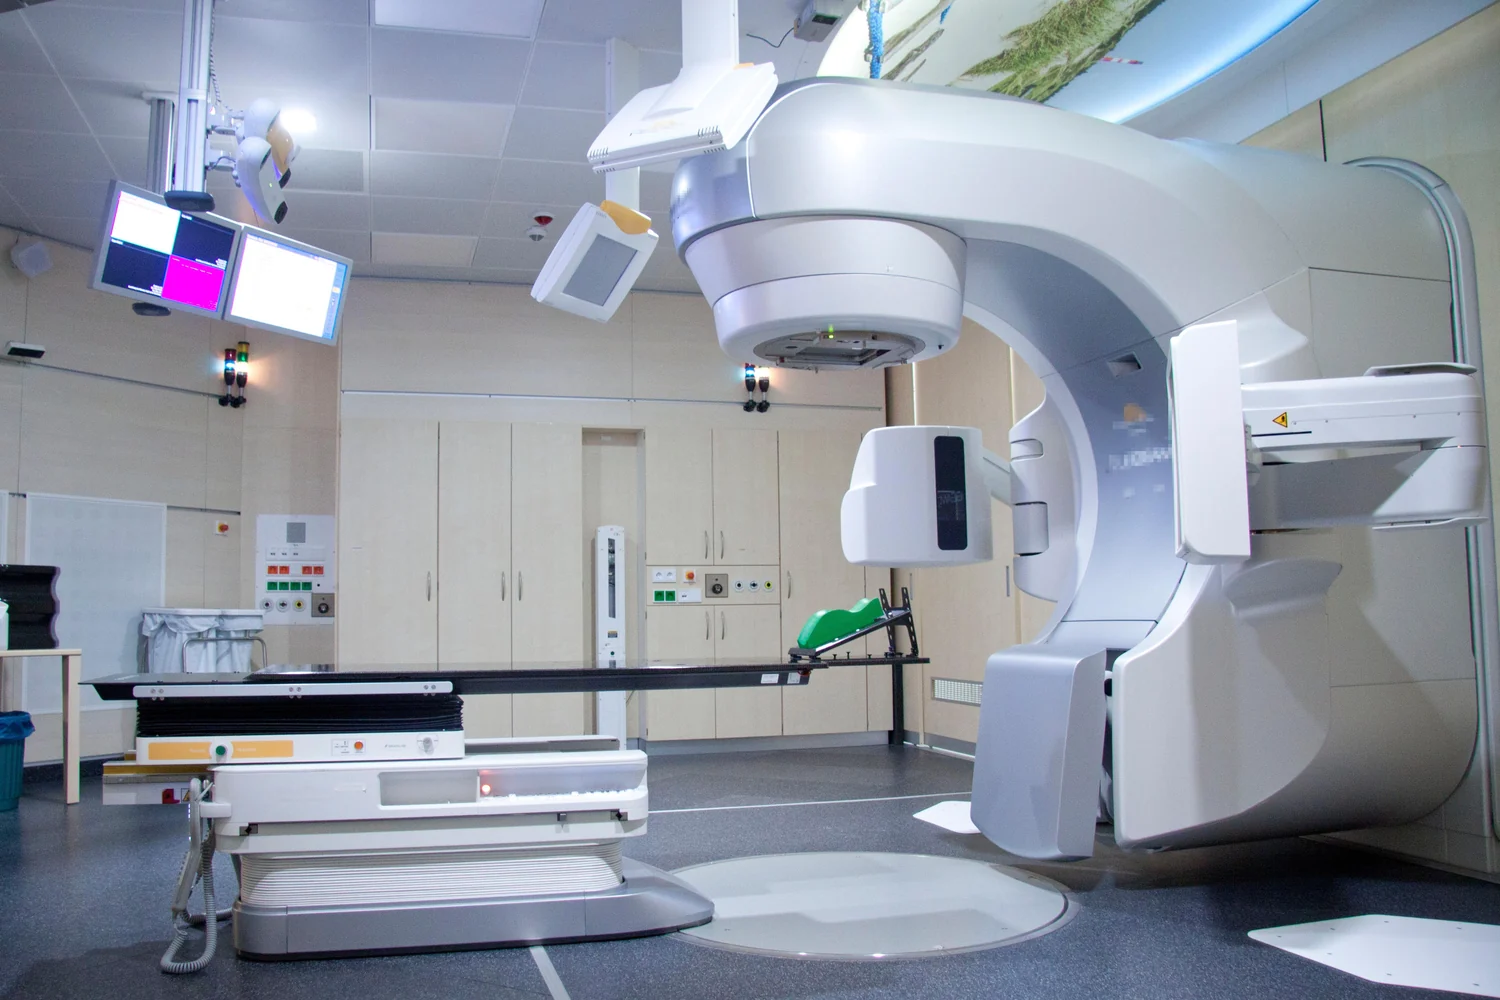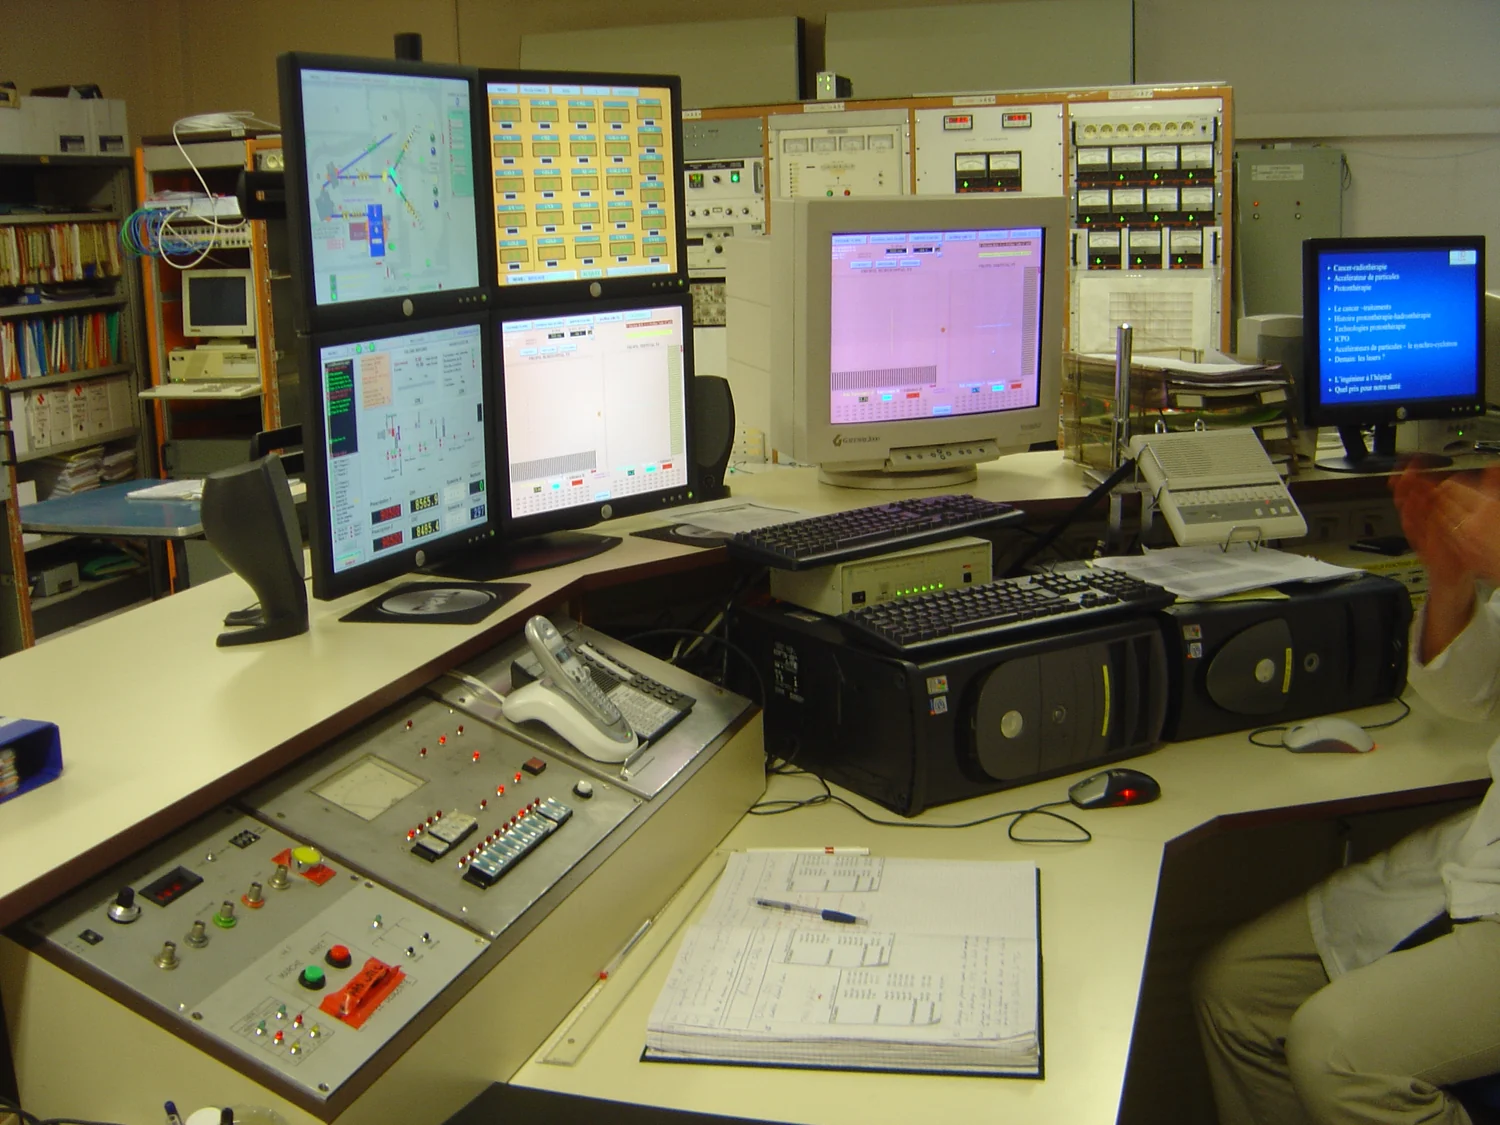
A proton beam can deposit much of its energy near a chosen depth and then fall sharply in dose. The familiar picture is persuasive: put the high-dose region inside a tumor and spare the tissue behind it. Yet an attractive depth-dose curve does not answer whether a person will swallow more comfortably, need fewer hospital visits, avoid a late complication, or live longer. Those outcomes depend on anatomy, treatment delivery, biology, and which alternative the proton plan is compared with. Understanding proton therapy means following that entire chain, rather than stopping at the Bragg peak.
1. The problem is a three-dimensional compromise
Radiotherapy uses ionizing radiation to damage cells so that a tumor can no longer sustain its growth. The same interactions can injure healthy tissue. This makes geometry central: treatment must cover both the visible disease and the clinically defined regions at risk while limiting exposure to nearby organs. The National Cancer Institute describes external-beam treatment as a planned distribution of radiation, not a beam that recognizes cancer cells. [1]
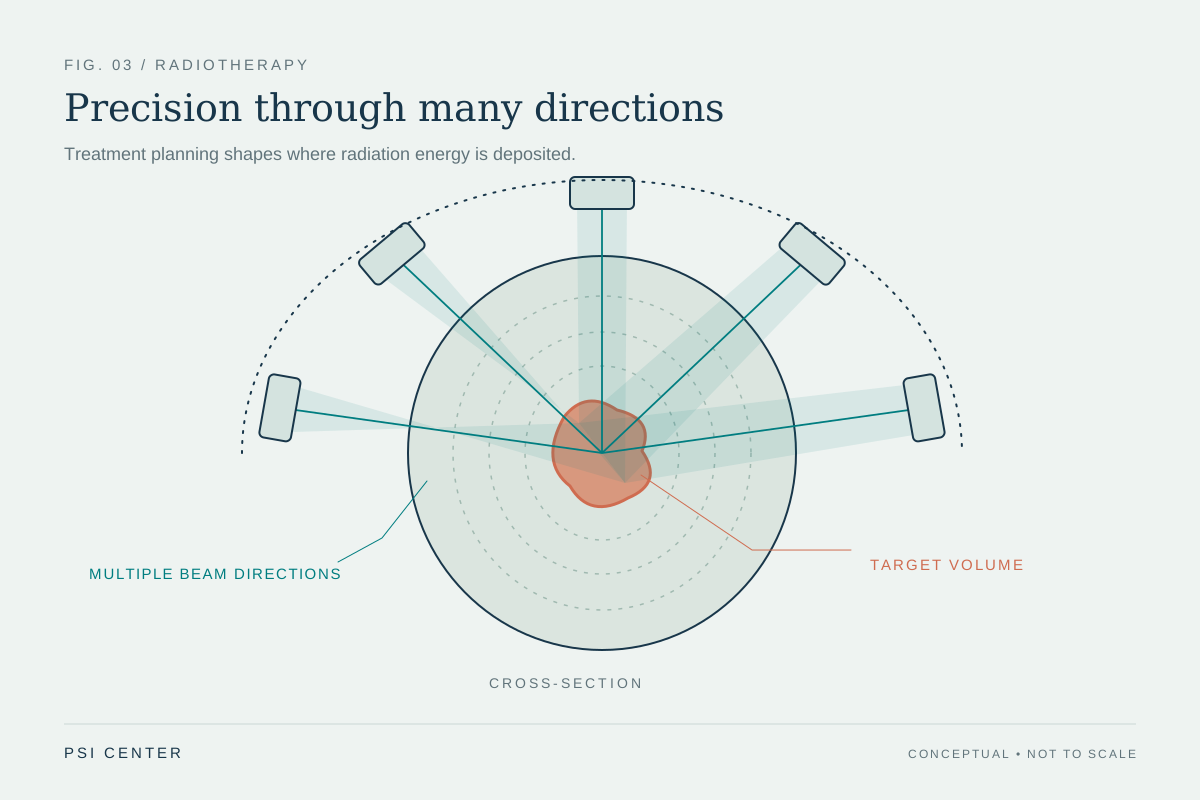
Modern photon treatment already takes this compromise seriously. Intensity-modulated radiotherapy, or IMRT, combines shaped beams from several directions. Each beam passes through some normal tissue, but their contributions add in the target. Proton treatment changes the available building blocks, especially their depth dependence. It competes with a highly optimized photon plan, rather than with an unshaped beam aimed through the body.
There are several ways for an improvement to matter. Reducing dose to a swallowing structure might reduce a particular toxicity. Reducing low-dose exposure elsewhere might matter over a much longer follow-up. Keeping a sensitive organ below a limit might make a difficult plan feasible. These are different claims and require different measurements. A plan can be better on one of them while being similar, uncertain, or worse on another.
2. Why slowing protons make a Bragg peak
A fast proton carries positive electric charge. As it travels through matter, it transfers energy through interactions with the material, particularly its electrons. Stopping power describes energy lost per unit distance. Over an important part of the slowing-down path, the energy deposited per unit length increases as the proton slows. Near the end of the range, that produces the pronounced maximum called the Bragg peak. NIST's PSTAR database provides material-dependent stopping powers and ranges; a range is not a universal number attached to the word proton. [2]
A real beam contains many particles. Their collision histories differ, so their stopping depths spread out. The beam also widens through scattering, and nuclear interactions can generate secondary particles. The practical dose distribution therefore has finite edges and a lower-dose surrounding component. A cartoon with a perfectly straight path, no entrance exposure, and an exact stopping point leaves out the features that determine how a treatment is planned.
The essential comparison concerns distributions. Photons interact probabilistically along their paths and transfer energy to charged particles in tissue; their dose does not terminate at a selected target depth. Protons offer a pronounced distal falloff, but still deliver entrance dose. For either technique, the clinically relevant object is the sum of all fields throughout a real three-dimensional anatomy. A single central-axis curve shows only one slice of that problem.
3. A tumor needs a volume of dose, not a single peak
A tumor has thickness. One narrow energy band cannot cover its full depth with the high-dose part of a pristine Bragg peak. Treatment must combine contributions at different depths. Passive-scattering systems can broaden the useful depth interval into a spread-out Bragg peak. Pencil-beam scanning instead steers small spots across the target and changes beam energy to address different depth layers. These are delivery strategies, not interchangeable labels for identical machines.
In intensity-modulated proton therapy, or IMPT, the planning problem also chooses how strongly the different spots and fields contribute. A spot is not a tiny independent treatment: its dose overlaps neighboring spots, and its weights contribute to a joint solution. Robust optimization research by Liu and colleagues demonstrates why a plan optimized for its nominal geometry alone can be too sensitive to plausible errors. [4]
This explains an otherwise surprising tradeoff. Greater modulation can improve a planned distribution while making its success depend on the coordinated delivery of many nonuniform components. If anatomy changes, those components may no longer add as intended. More adjustable parameters make better solutions possible, but they also make explicit testing of the solution more important. The quality question is not how many spots the machine can paint; it is how reliably the accumulated distribution achieves the intended objectives.
4. The hidden coordinate is water-equivalent depth
A scanner provides images and x-ray attenuation information, but a proton planner needs the energy loss along each proton path. These are related quantities, not the same measurement. Tissue composition, density, CT calibration, and the dose-calculation method enter the conversion. A geometric distance through lung, bone, air, and soft tissue cannot simply be treated as the same distance through water.
Water-equivalent path length is a useful accounting coordinate: it expresses a path through mixed material as the thickness of water with an equivalent stopping effect under the model. In a simple layered approximation, add each layer's physical thickness multiplied by its relative stopping power. This is a conceptual approximation, not a substitute for a clinical dose engine. NIST's documentation also distinguishes stopping-power and range quantities that are easy to blur together when discussing penetration. [3]
The uncertainty is consequential because the useful distal edge is steep. A change in the material before a target can shift where the high-dose region ends, even when the machine points at the same location. Site-specific calculations comparing algorithms have shown that the importance of these differences depends on anatomy; a single generic error number cannot describe every treatment site. [5]
5. Worked example: a modest percentage becomes millimeters
Consider an invented, uniform-water example in which the relevant planned range is 20 centimeters. Suppose a sensitivity exercise changes the estimated water-equivalent range by 3%. The scale of that change is 0.03 × 20 cm = 0.6 cm, or 6 mm. The percentage is small; the spatial shift can still matter when the dose is changing rapidly over a short distance. These values are chosen to explain the arithmetic. They are not a clinical uncertainty allowance or a recommended treatment margin.
Now change the geometry rather than the scale factor. Imagine a beam path where a 1 cm water-equivalent layer is replaced, in this simplified model, by a layer with relative stopping power 0.3. Its contribution to water-equivalent path length changes from 1 cm to 0.3 cm, a reduction of 7 mm. Everything beyond it is reached after less energy has been lost. A fixed physical coordinate is therefore not automatically a fixed proton-range coordinate.
The two examples represent different error mechanisms: calibration-like changes and localized anatomical changes. They should not be added as though they were independent measurements of one patient. Their value is explanatory. They show why a beam's stopping behavior can change upstream of the tumor and why checking the target's position alone is insufficient. The published analysis by Paganetti documents multiple distinct contributors to proton-range uncertainty and the role of more realistic transport calculations. [6]
6. Robustness asks what happens when the model is wrong
A conventional plan image answers a conditional question: what dose is predicted if the anatomy, setup, and model are as assumed? A robustness evaluation asks additional questions after perturbing those assumptions. The target can shift, the effective range can change, and the calculated dose can be recomputed. The result is a family of possible distributions rather than a single reassuring picture.
Optimization can incorporate such scenarios from the start, trading some nominal-plan attractiveness for less sensitivity. Multi-criteria work has explicitly explored the compromise between organ sparing and robustness. The scenarios remain assumptions: an optimizer cannot guarantee protection against an anatomical change or delivery error it does not represent. A worst-case result is worst-case within the tested set, not a proof against every possible event. [7]
Time adds a separate problem for scanned beams. If the target moves while spots and energy layers are delivered, particular parts of the target may receive a different combination of spots than a static calculation predicts. A measurement-based study of respiratory interplay demonstrates that the trajectory and timing of motion matter, not just its maximum displacement. Motion-management approaches include gating and repeat scanning, but their effectiveness and time cost depend on the delivery system and motion pattern. [8]
7. Absorbed dose and biological effect are different quantities
Absorbed dose is energy deposited per unit mass. One gray equals one joule per kilogram. That definition is exact; the tissue response to a gray is not universal. Radiation damages DNA directly and through chemical species formed in the surrounding material, and cells differ in their ability to tolerate or repair the resulting damage. The CDC distinguishes repaired, altered, and lethally damaged cells rather than treating every interaction as an immediate cell death. [9]
Relative biological effectiveness, or RBE, compares the doses of two radiations needed to produce a defined biological endpoint under specified conditions. Proton practice commonly uses an RBE weighting of 1.1 relative to a reference photon radiation. That conventional value is not a measured constant for every tissue, endpoint, and location. The IAEA's ion-beam report discusses the approximation and the changes in biological effectiveness near the distal region. [10]
Physical and biological uncertainty can therefore interact. Linear energy transfer describes how densely energy is deposited along a track; it changes as a proton slows. A plan with acceptable physical-dose coverage may still deserve attention to where the highest-LET regions lie. This does not mean the entire Bragg peak is an unexplained hazard. It means that a single colored dose image and a fixed scaling factor are models with limits, which must be understood when comparing plans.
8. Worked example: the same mean can hide different distributions
Imagine a deliberately artificial 1 kg organ with uniform density. Distribution A gives 5 Gy to one fifth of its mass and zero to the rest. Its mass-averaged absorbed dose is 0.2 × 5 Gy = 1 Gy. Distribution B gives 1.25 Gy to four fifths of the mass and zero to the rest. Its mean is also 0.8 × 1.25 Gy = 1 Gy. Both deposit 1 joule in that 1 kg organ. They do not expose the same amount of tissue to the same local dose.
A mean-dose number alone cannot tell us which distribution better preserves function. We would need to know what the organ does, whether a small critical substructure is involved, how the dose is delivered over time, and which biological response is relevant. Even a dose-volume histogram loses spatial information: it records how much volume receives a dose, rather than showing precisely where that volume sits.
This is why a claim such as lower normal-tissue dose should be unpacked. Lower maximum dose, lower mean dose, lower integral energy, and a smaller volume above a chosen level describe different achievements. None is a complete patient outcome. The toy example is an original arithmetic illustration, not an organ-tolerance model, and its numbers must not be read as a safe exposure, prescription, or comparison between actual clinical plans.
| Quantity | Distribution A | Distribution B |
|---|---|---|
| Mass receiving nonzero dose | 0.2 kg | 0.8 kg |
| Dose within that mass | 5 Gy | 1.25 Gy |
| Mean over the full 1 kg | 1 Gy | 1 Gy |
| Energy deposited | 1 J | 1 J |
9. The beam model has to survive measurement
A sophisticated dose calculation is useful only if the relationship between the model and the machine is established. Commissioning measures how the system behaves across its intended conditions and checks the treatment-planning representation against those measurements. AAPM Task Group 185 explicitly includes beam delivery, positioning, image guidance, CT stopping-power calibration, and planning-system modeling. The scanner, computer, and accelerator are parts of one measurement chain. [11]
Reference dosimetry anchors the amount of delivered radiation to calibrated measurements. The IAEA code of practice for external-beam dosimetry uses standards of absorbed dose to water. Conceptually, a detector reading becomes a dose estimate through calibration and corrections; the displayed number is not self-validating because it has several decimal places. Uncertainty belongs to the measurement and conversion, not just to the machine's ability to repeat a setting. [12]
This engineering work explains why the clinical intervention cannot be reduced to buying a particle accelerator. A functioning treatment service also needs reliable imaging, positioning, calculation, verification, and responses to changes between planning and delivery. Physics quality assurance supports the argument that the intended dose was delivered. Clinical outcome studies address the next question: what that delivered dose accomplished for the people treated.
10. Prostate evidence: ask which improvement was measured
The cited 2024 PARTIQoL phase III conference abstract randomized 450 people with localized prostate cancer to proton therapy or IMRT. Its primary endpoint was change in patient-reported bowel quality of life at 24 months. It reported no measurable difference between groups on that endpoint, with excellent disease control in both arms. The source is explicitly a conference report, not a substitute for checking subsequent full reports and follow-up. [13]
The trial's reported result is narrower and more useful than a slogan. It does not mean proton beams lack a finite range. It means the physical differences did not translate into the expected measurable improvement in this population, compared with this modern alternative, on the reported outcomes. Conversely, results in localized prostate disease cannot settle a question about a different organ, a child with a long future risk horizon, or a tumor beside a critical structure.
A clinical comparison needs enough room for both technologies to perform well. If the alternative already keeps the relevant organ exposures low, an additional dosimetric reduction may produce little detectable change on a questionnaire. That is a possible explanatory framework, not a proven account of each PARTIQoL participant. The distinction between a trial result and a proposed explanation for it is part of reading evidence carefully.
11. Two head-and-neck trials make the evidence more interesting
A US phase III trial published online in December 2025 randomized 440 people with oropharyngeal cancer to IMPT or IMRT. It found IMPT noninferior for progression-free survival, with several toxicity measures favoring protons. The prespecified noninferiority margin was nine percentage points at three years. Reported 5-year overall survival was 90.9% versus 81.0% (hazard ratio 0.58; 95% confidence interval 0.34–0.99). However, substantial crossover complicated interpretation, and safety analyses used the per-protocol population. The trial's favorable findings are important evidence, rather than a license to generalize to every head-and-neck tumor. [14]
The 2026 UK TORPEdO trial randomized 205 people with locally advanced oropharyngeal cancer. Its 12-month co-primary endpoints were physical quality of life and a nutritional composite: feeding-tube dependence or severe weight loss of at least 20%. It did not demonstrate an IMPT advantage on either. The mean physical-score difference was 1.3 points (97.5% confidence interval −3.7 to 6.2). Feeding-tube dependence was about 2% in each arm, but severe weight loss occurred in 18% versus 6%. The combined nutritional odds ratio was 2.80 (97.5% confidence interval 0.75–10.4), an inconclusive comparison. Its primary questions and follow-up differed from the US trial. [15]
These reports cannot be reconciled by counting one favorable paper and one unfavorable paper. We need to compare the population, systemic therapy, endpoint definitions, assessment time, actual treatment received, missing measurements, and follow-up. A benefit in acute swallowing toxicity can coexist with similar scores on a broader questionnaire a year later. A noninferiority trial's primary success also does not automatically establish superiority on every secondary outcome.
Uncertainty intervals matter. An interval spanning several points in either direction is not proof that two treatments are identical, just as a secondary survival result near a conventional significance threshold is not a universal survival promise. The responsible conclusion is specific: recent trials strengthen the evidence base and show that the answer depends on which patient group and which outcome we ask about.
| Trial/report | Question emphasized | Interpretation |
|---|---|---|
| PARTIQoL, 2024 abstract | 24-month bowel quality of life | No measurable proton advantage reported. [13] |
| US oropharyngeal trial, 2025/2026 | Progression-free survival noninferiority | Primary endpoint met; toxicity findings favored IMPT. [14] |
| TORPEdO, 2026 | 12-month function and nutritional outcomes | Co-primary endpoints did not show an IMPT advantage. [15] |
12. How to read the next proton-therapy claim
Start by identifying the level of the claim. A phantom experiment can show that a beam stops where a model predicts. A planning study can show that an alternative distribution looks better for selected anatomies. A biological experiment can show a different response in a defined system. A randomized clinical trial can estimate differences between assigned treatments in its enrolled population. Each contributes evidence, but they do not answer the same question.
Next ask what was actually compared. Proton and photon techniques evolve; older passive-scattering results and modern IMPT results should not be silently treated as one intervention. The comparator's planning quality matters too. A result against an outdated or weak alternative is less informative about a choice between two carefully delivered contemporary plans. Read whether the claim concerns a predicted complication, an observed adverse event, a patient-reported function, cancer control, or survival.
Finally, look for the tradeoff the headline leaves out. Does the dosimetric advantage remain under plausible range and setup errors? Was motion included? Which endpoints improved, for how long, and with what uncertainty? Were access barriers or crossover important? The physical advantage of a finite range is real. Establishing its value means connecting it to reliable delivery and to outcomes that matter in a clearly defined clinical setting. That is a deeper argument than the Bragg-peak picture, and a more useful one.
Explore the physics: an explanatory diagram
Sources & further reading
- External Beam Radiation Therapy National Cancer Institute
- PSTAR: Stopping Power and Range Tables for Protons NIST
- ESTAR, PSTAR, and ASTAR: Significance of Calculated Quantities NIST
- Robust optimization of intensity modulated proton therapy Liu et al., Medical Physics (2012)
- Site-specific range uncertainties caused by dose calculation algorithms for proton therapy Schuemann et al., Physics in Medicine & Biology (2014)
- Range uncertainties in proton therapy and the role of Monte Carlo simulations Paganetti, Physics in Medicine & Biology (2012)
- Including robustness in multi-criteria optimization for intensity-modulated proton therapy Chen et al., Physics in Medicine & Biology (2012)
- Measurement-based study on characterizing symmetric and asymmetric respiratory motion interplay effect on target dose distribution in proton pencil beam scanning Journal of Applied Clinical Medical Physics (2020)
- About Health Effects of Radiation CDC
- Relative Biological Effectiveness in Ion Beam Therapy, Technical Reports Series No. 461 IAEA (2008)
- Clinical commissioning of intensity modulated proton therapy systems: AAPM Task Group 185 AAPM (2020)
- Absorbed Dose Determination in External Beam Radiotherapy, TRS-398 IAEA
- PARTIQoL: Phase III randomized clinical trial of proton therapy vs. IMRT for localized prostate cancer — conference abstract Efstathiou et al., International Journal of Radiation Oncology Biology Physics (2024 meeting abstract)
- Proton versus photon radiotherapy for patients with oropharyngeal cancer in the USA: a multicentre, randomised, open-label, non-inferiority phase 3 trial Frank et al., The Lancet (online 2025; issue 2026)
- Proton beam therapy for oropharyngeal cancer (TORPEdO): a phase 3, randomised controlled trial Thomson et al., The Lancet (2026)
Sources checked: 30 October 2026. The calculations illustrate physical models; they are not clinical settings.
Prepared for the independent PSI Center reading library. About edition dates and source checking.
This explainer describes scientific principles. It does not assess individual treatment choices.