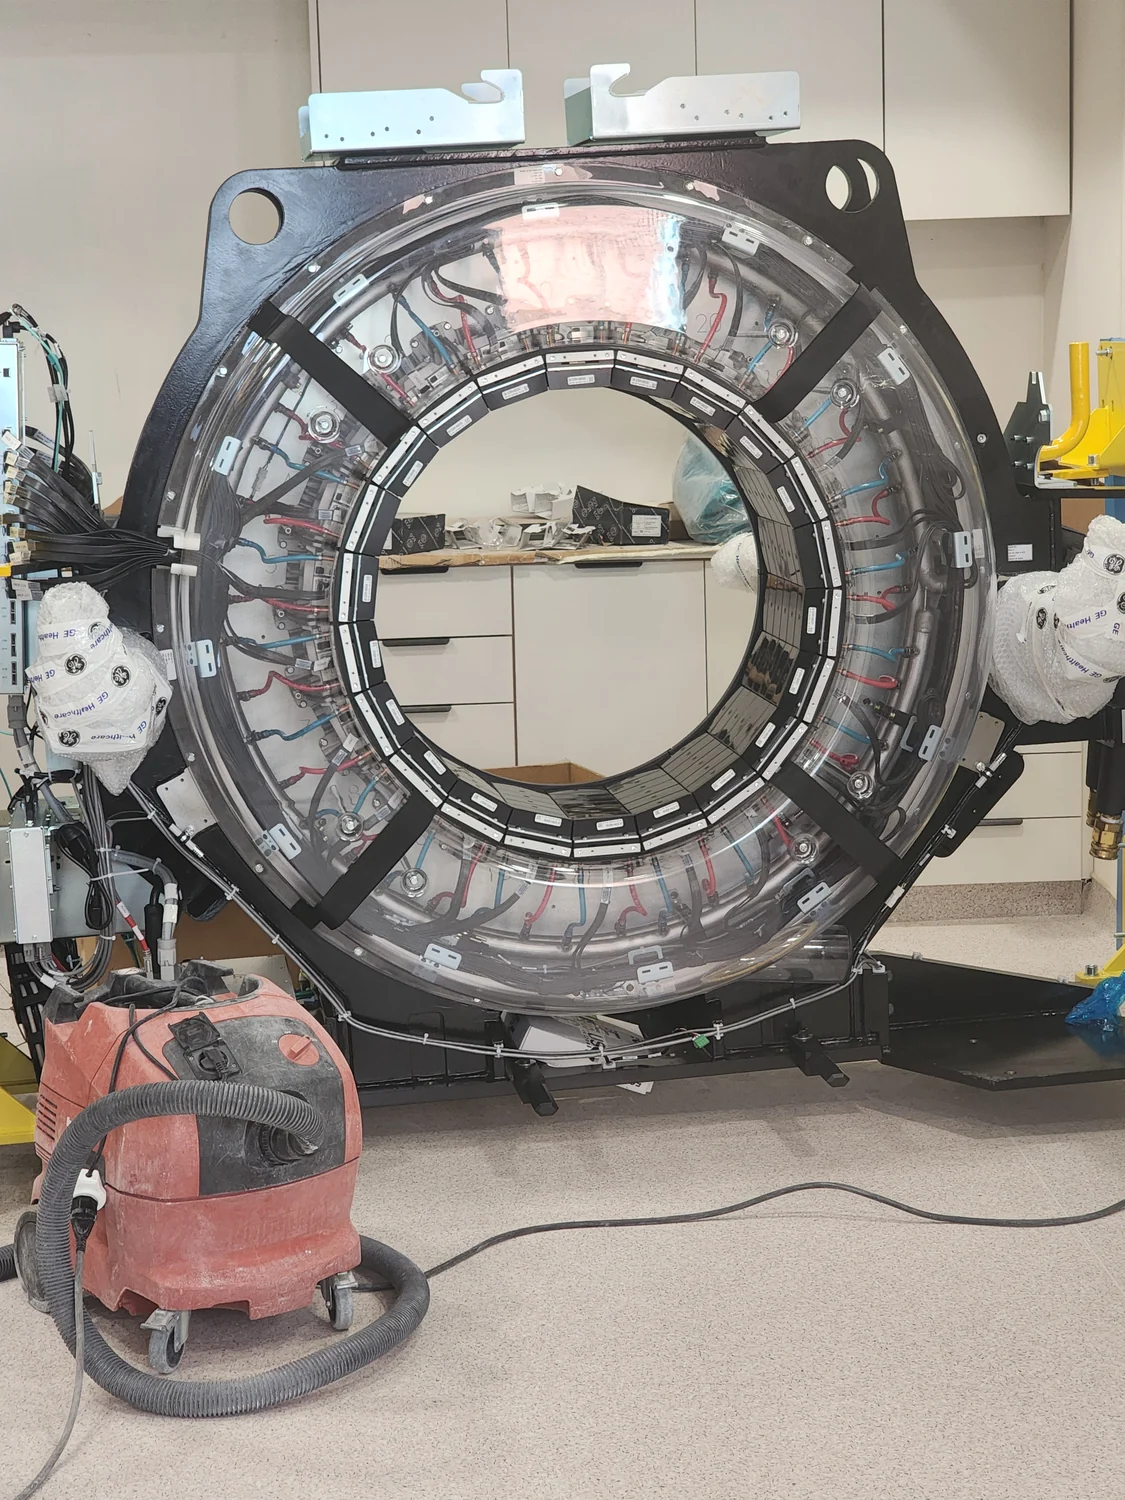
Computed tomography still begins with an X-ray beam passing through the body, but a photon-counting scanner changes what happens at the detector. Instead of converting incoming X-rays into light and summing that light over an exposure, a semiconductor detector turns each interaction into an electrical pulse. Electronics compare each pulse with energy thresholds, producing counts in several energy ranges. The extra information can support material-sensitive reconstructions, but the output is a calibrated measurement made by a detector system—not a direct inventory of every photon or an automatic diagnosis. [1]
The detector sees what gets through the body
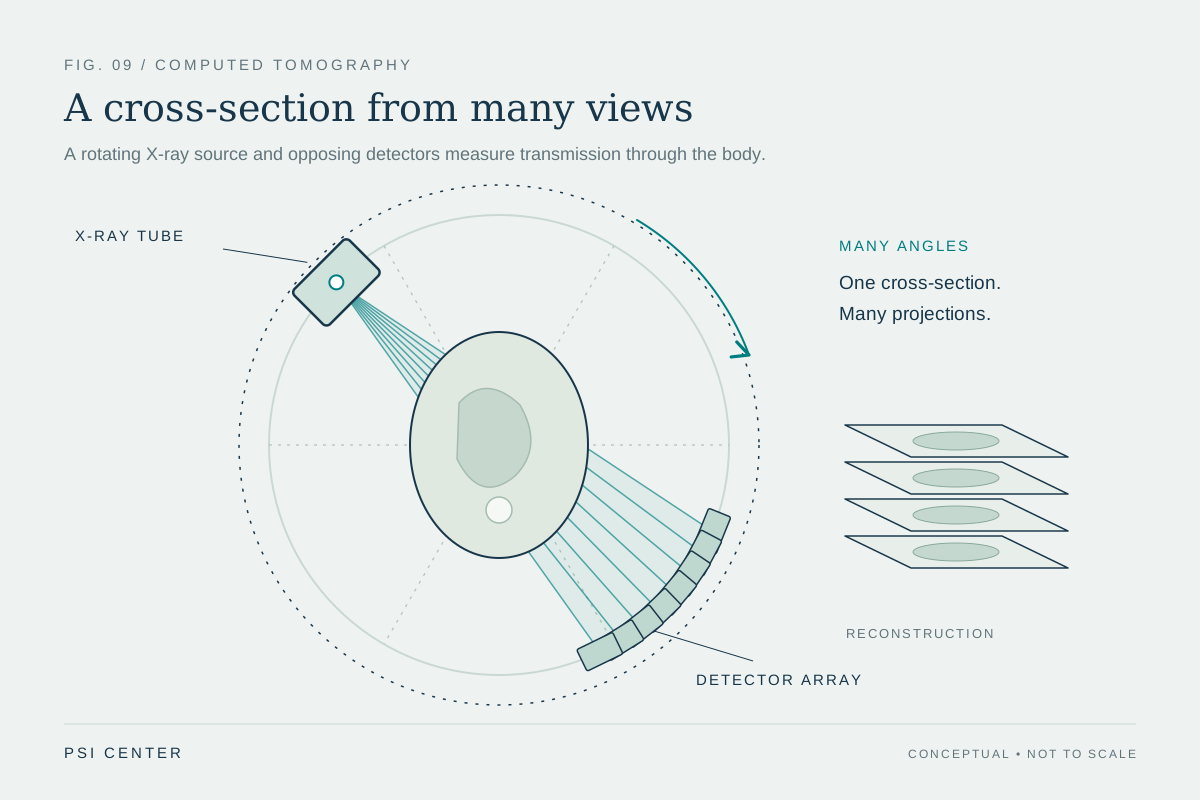
A CT tube sends a spectrum of X-ray energies through the body from many angles. Bone, soft tissue and contrast material attenuate that beam differently, and the detectors record the transmitted signal. Reconstruction combines measurements from many views to estimate how strongly each location attenuated X-rays. Photon-counting CT keeps this overall geometry: its distinct change is how the detector records the transmitted beam. [2]
A familiar detector uses a scintillator: an absorbed X-ray produces visible light, and photodiodes convert that light into an electrical signal accumulated during a measurement interval. A photon-counting detector uses a semiconductor that converts the X-ray interaction more directly into mobile charge. This removes the intermediate light-spread step and gives the electronics an event-like pulse to analyze. [1]
One interaction becomes a shaped electrical pulse
When an X-ray deposits energy in the semiconductor, it creates charge carriers. An electric field moves those carriers through the sensor; their motion induces a current that the readout electronics shape into a pulse. In a simplified case, a larger deposited energy produces a larger pulse. The pulse height is therefore an estimate related to deposited energy, not a perfect measurement of the original photon energy. [1]
This distinction matters because a photon may scatter or produce secondary radiation inside the sensor. A threshold circuit does not see the photon’s history; it sees a processed waveform and decides which thresholds it crosses. [1]
Thresholds divide counts into energy ranges
Imagine two thresholds, 20 and 50 kiloelectronvolts (keV). A low-threshold channel can count pulses above 20 keV, while another counts pulses above 50 keV. Subtracting the higher-threshold count from the lower one estimates how many events fell between 20 and 50 keV. With several thresholds, the system can construct multiple energy bins. [2]
For a simple numerical example, suppose one pixel records 10,000 counts above 20 keV and 4,000 above 50 keV during the same exposure. The estimated 20–50 keV bin contains 6,000 counts. These are illustrative numbers, not a scanner specification. In real measurements, the calculation depends on detector response, calibration, noise and how the acquisition defines its thresholds. [2]
Energy ranges add a second kind of contrast
Different materials change an X-ray spectrum in different ways. If a scanner records only one broad signal, much of that spectral detail is combined. Energy-bin measurements retain some information about how the transmitted photons are distributed across energies. Reconstruction software can use the resulting measurements to estimate material contributions or create images emphasizing selected energy behavior. This is why photon counting is also described as energy-resolving CT. It is the combination of detector measurements and reconstruction models that makes such images possible, not the thresholds alone. [1]
Threshold placement is a design choice tied to the task. Narrower ranges can separate spectral behavior but may contain fewer counts and more statistical noise. The 2017 research work explicitly modeled the relation between object attenuation, threshold configuration, detector response, dose and noise, then used calibration measurements to estimate image noise. [2]
Why the count is not perfect
Charge sharing occurs when charge from one interaction spreads across neighboring pixels. The event may then appear as two smaller pulses instead of one correctly sized pulse. Secondary fluorescence or scattered photons can also move some deposited energy to another location. These effects may shift events between bins or create counts that do not correspond one-to-one with incident photons. [1]
At high flux, pulses can overlap before the electronics finish processing them. This pulse pileup can merge events, lose counts or alter apparent pulse height; finite processing time also creates dead time. The practical design balances small pixels, fast electronics, charge collection and stable thresholds. Smaller pixels can reduce the number of photons arriving at each channel, but can make charge sharing more likely at pixel boundaries. Photon counting changes the error budget rather than removing it. [1]
What the technology establishes—and what it does not
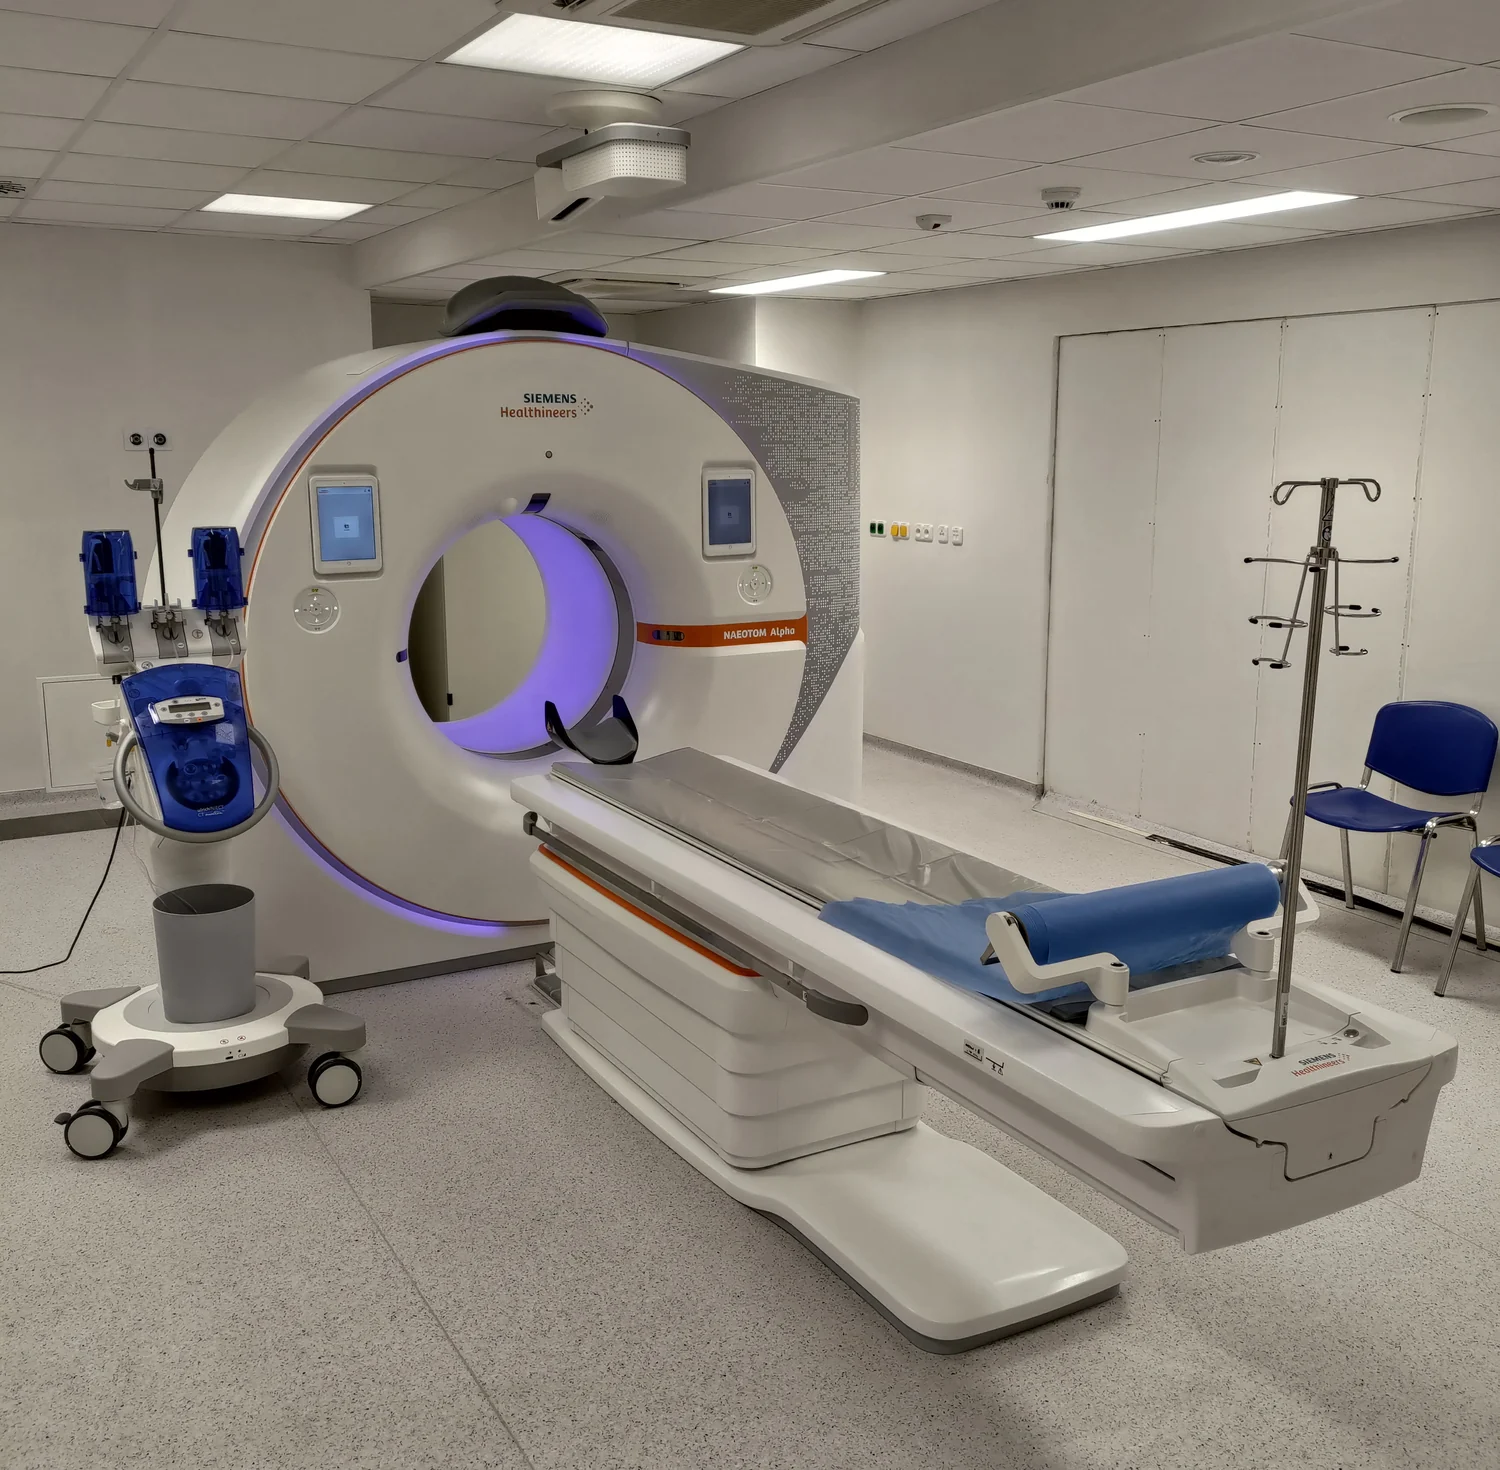
The FDA’s 510(k) database records a September 2021 “substantially equivalent” decision for the NAEOTOM Alpha CT system. That is a regulatory status for a particular device submission; the database entry is not a general finding that photon-counting CT is clinically superior to every other CT system. [3]
A careful comparison therefore asks which detector and protocol were used, how the thresholds were calibrated, what phantom or patient task was measured, and which endpoint improved. Better energy information can be useful for material separation or image reconstruction, but image quality, dose, quantitative accuracy and clinical performance are separate questions. The detector supplies richer measurements; studies must still show when that richness changes a health decision for the better. [1]
Explore the physics: an explanatory diagram
Sources & further reading
- A physics primer on photon-counting detectors in CT: Physics, signal formation, and performance Medical Physics (2026)
- Estimation of signal and noise for a whole-body research photon-counting CT system Journal of Medical Imaging (2017)
- 510(k) Premarket Notification: NAEOTOM Alpha, Scan&GO (K211591) U.S. Food and Drug Administration (2021)
Sources checked: 16 November 2026. The calculations illustrate physical models; they are not clinical settings.
Prepared for the independent PSI Center reading library. About edition dates and source checking.
This explainer describes scientific principles. It does not assess individual treatment choices.