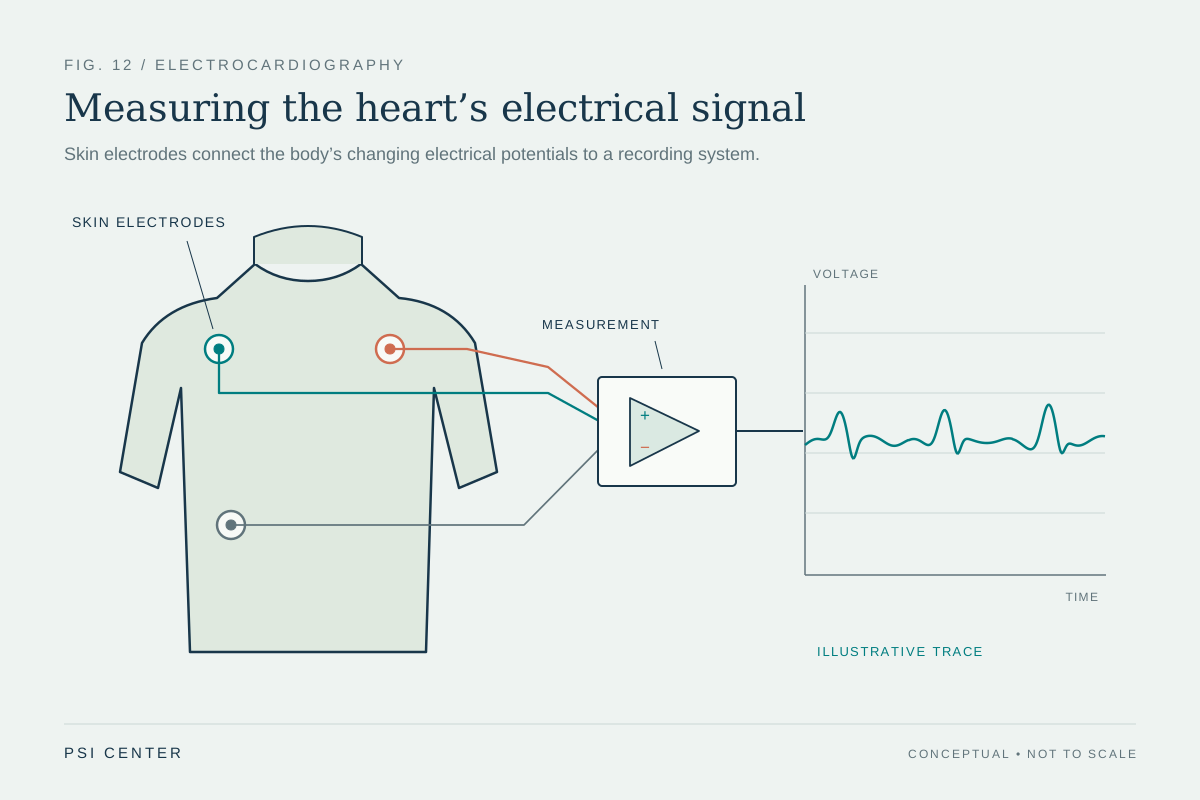
How does a pair of sticky sensors on the skin detect a heartbeat’s electrical activity? The heart’s cells generate electrical changes as they activate and recover, and those changes spread through the body. Electrodes measure tiny voltage differences at the skin; the instrument records how those differences vary over time. The resulting peaks and waves are not the heart’s mechanical squeeze itself, but an electrical trace linked to the sequence that coordinates each beat.
Electrical activation coordinates a pump
The heart is a pump whose chambers contract in a coordinated sequence. Its electrical system controls the rate and rhythm of the beat, helping the chambers squeeze in an order that moves blood through the body [2]. Before muscle can contract, electrical changes spread across heart tissue. This changing pattern creates fields that extend through surrounding tissues and fluids to the skin.
An electrocardiogram, abbreviated ECG or EKG, records those electrical signals. It does not send current into the heart; it measures signals already produced by the body [1]. A useful analogy is listening to a distant orchestra through vibrations in a room: the sensor captures a pattern transmitted through the surroundings, rather than placing a microphone inside every instrument.
Electrodes measure differences
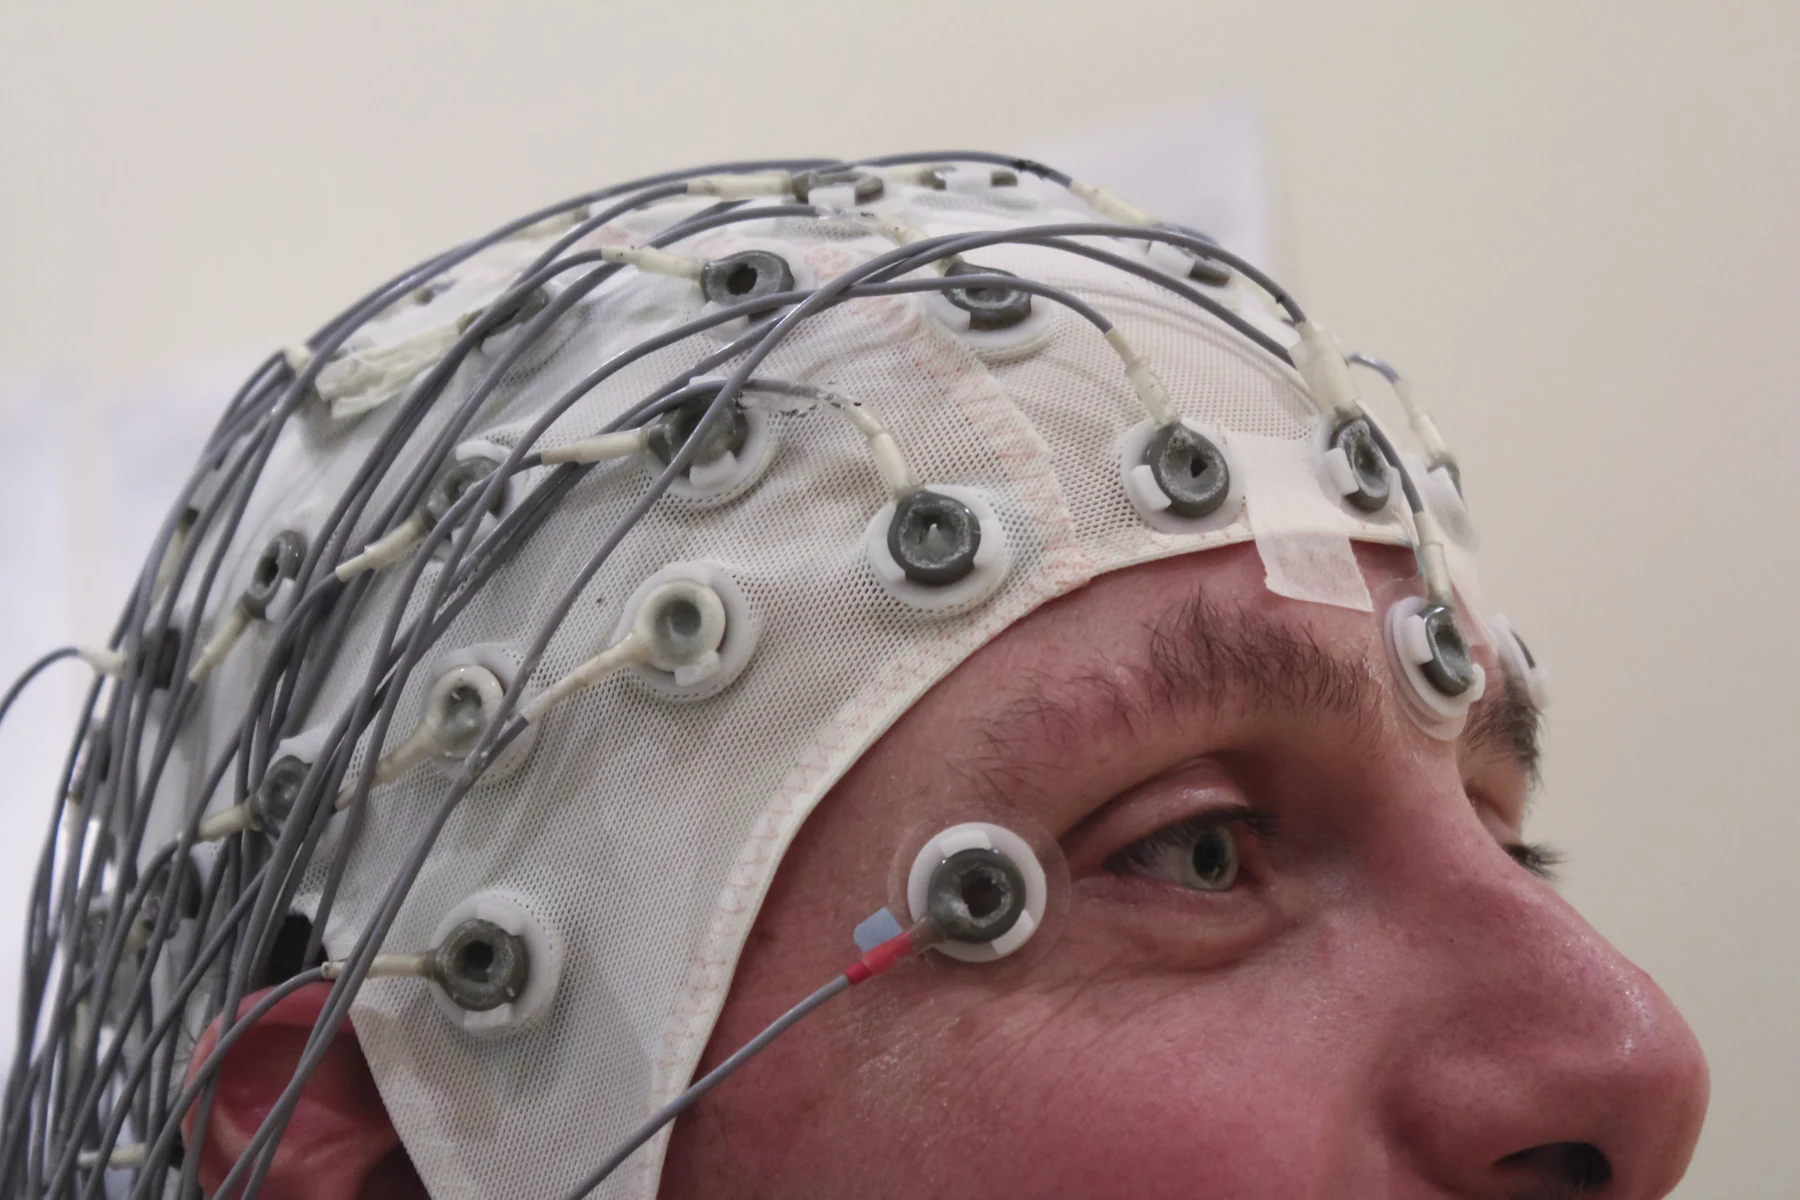
An ECG uses several electrodes attached to the skin, commonly on the arms, legs, and chest. Wires connect them to a recorder. The machine compares voltages at different locations, because a voltage difference across electrodes changes as the heart’s electrical wavefront moves through the body. Each arrangement of electrodes provides a view from a different direction; the familiar printed trace is a set of these changing measurements over time [1].
The trace’s shape reflects the timing and direction of electrical activity, not a literal outline of the heart. A wave moving toward one measurement direction can produce a different signal from one moving away. This is why ECG interpretation depends on patterns across leads and on context, rather than on treating a single spike as a standalone picture of a specific chamber [1].
Three landmarks in a beat
A standard tracing has three named features. The P wave corresponds to electrical activity associated with the upper chambers, the atria. The QRS complex is the sharp group of deflections associated with activation of the lower chambers, the ventricles. The T wave reflects recovery of the ventricles after contraction [1]. These labels let clinicians describe timing and sequence in a shared vocabulary.
Imagine the signal as a brief timetable: a small first event, a rapid central event, then a later recovery phase. The spacing and regularity can help show how fast the heart is beating and whether its rhythm is steady or irregular. The ECG records electrical timing; it does not directly measure how much blood the heart pumps or establish the cause of every unusual pattern [1] [2].
A short trace has a time window
A routine ECG takes only a few minutes, so it samples the heart’s activity during that short interval. If an electrical irregularity comes and goes, it may not occur during the recording. Longer-term monitors address that sampling problem by recording over days or longer, or by capturing events when they occur [1]. The choice of recording duration changes which episodes can be observed.
An ECG can help identify patterns that may signal a heart problem, but its result is interpreted alongside symptoms, medical history, and other tests. It can contribute information about rate, rhythm, and the strength and timing of signals through the heart; the trace alone does not diagnose a condition [1]. The instrument is powerful because it translates invisible electrical coordination into a measurable record, and limited because that record is only one view over time.
Explore the physics: an explanatory diagram
Sources & further reading
- Electrocardiogram MedlinePlus
- How the Heart Works NHLBI
Prepared for the independent PSI Center reading library. About edition dates and source checking.
This explainer describes scientific principles. It does not assess individual treatment choices.