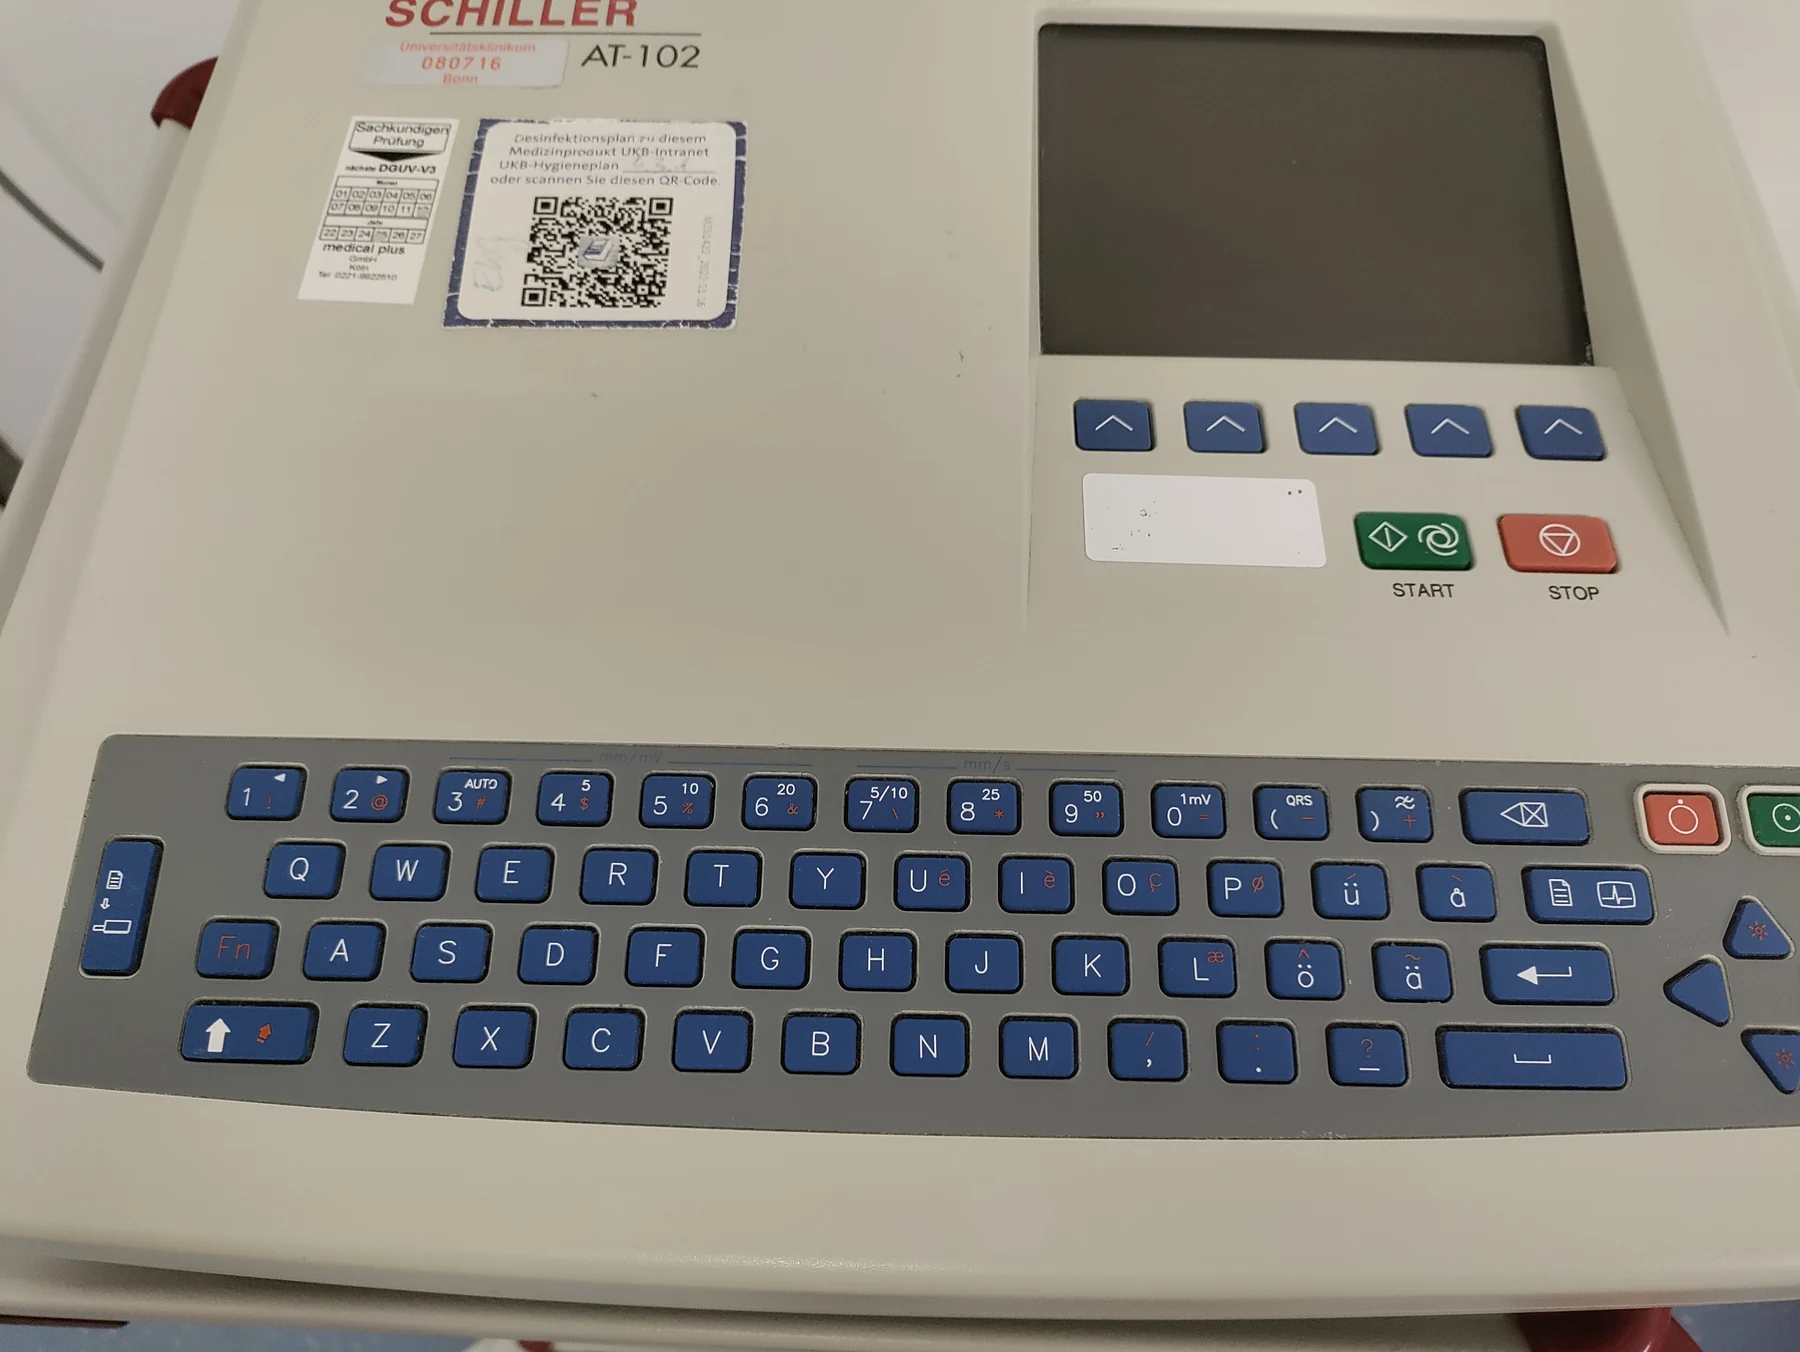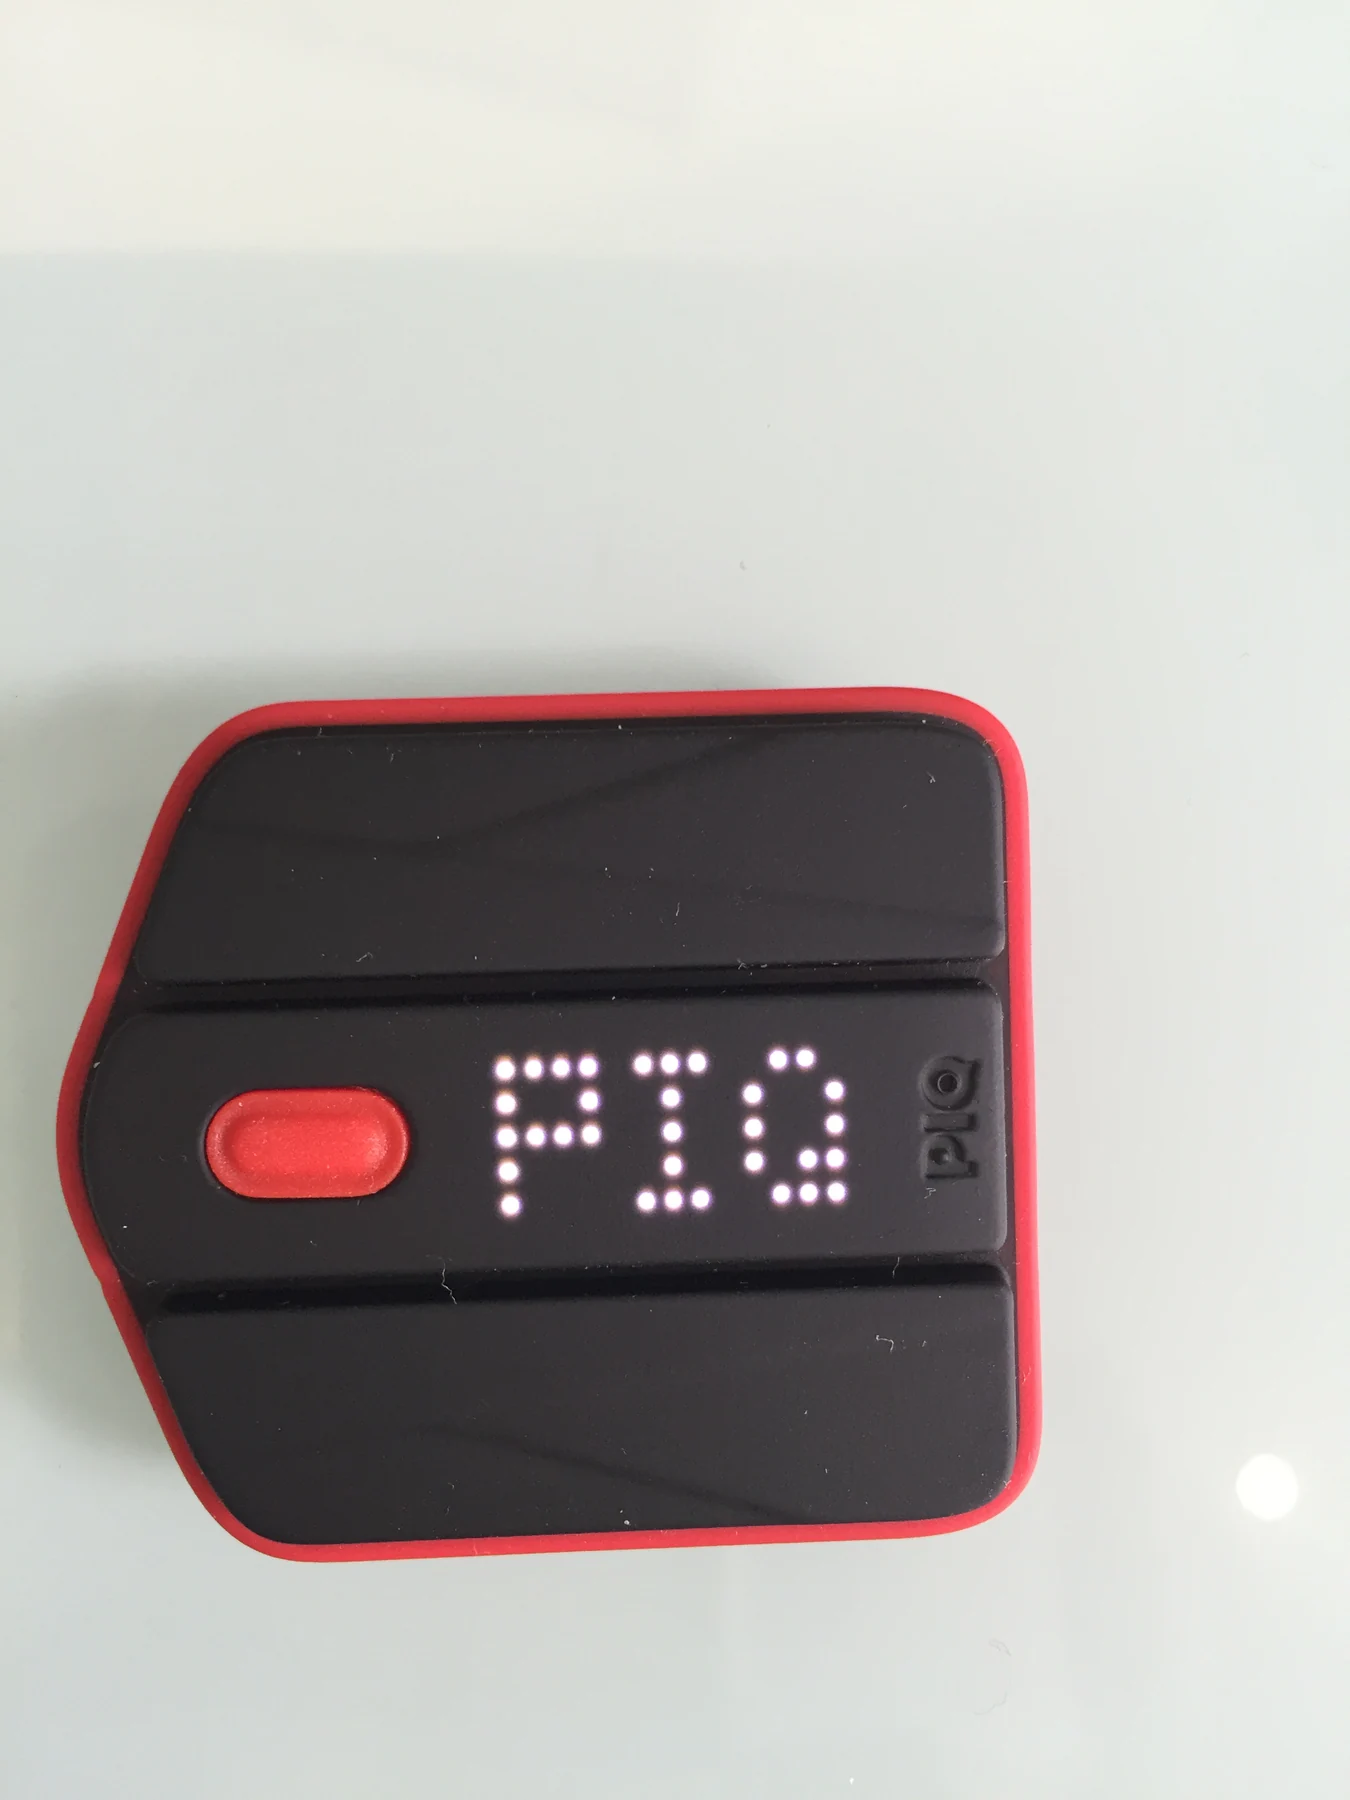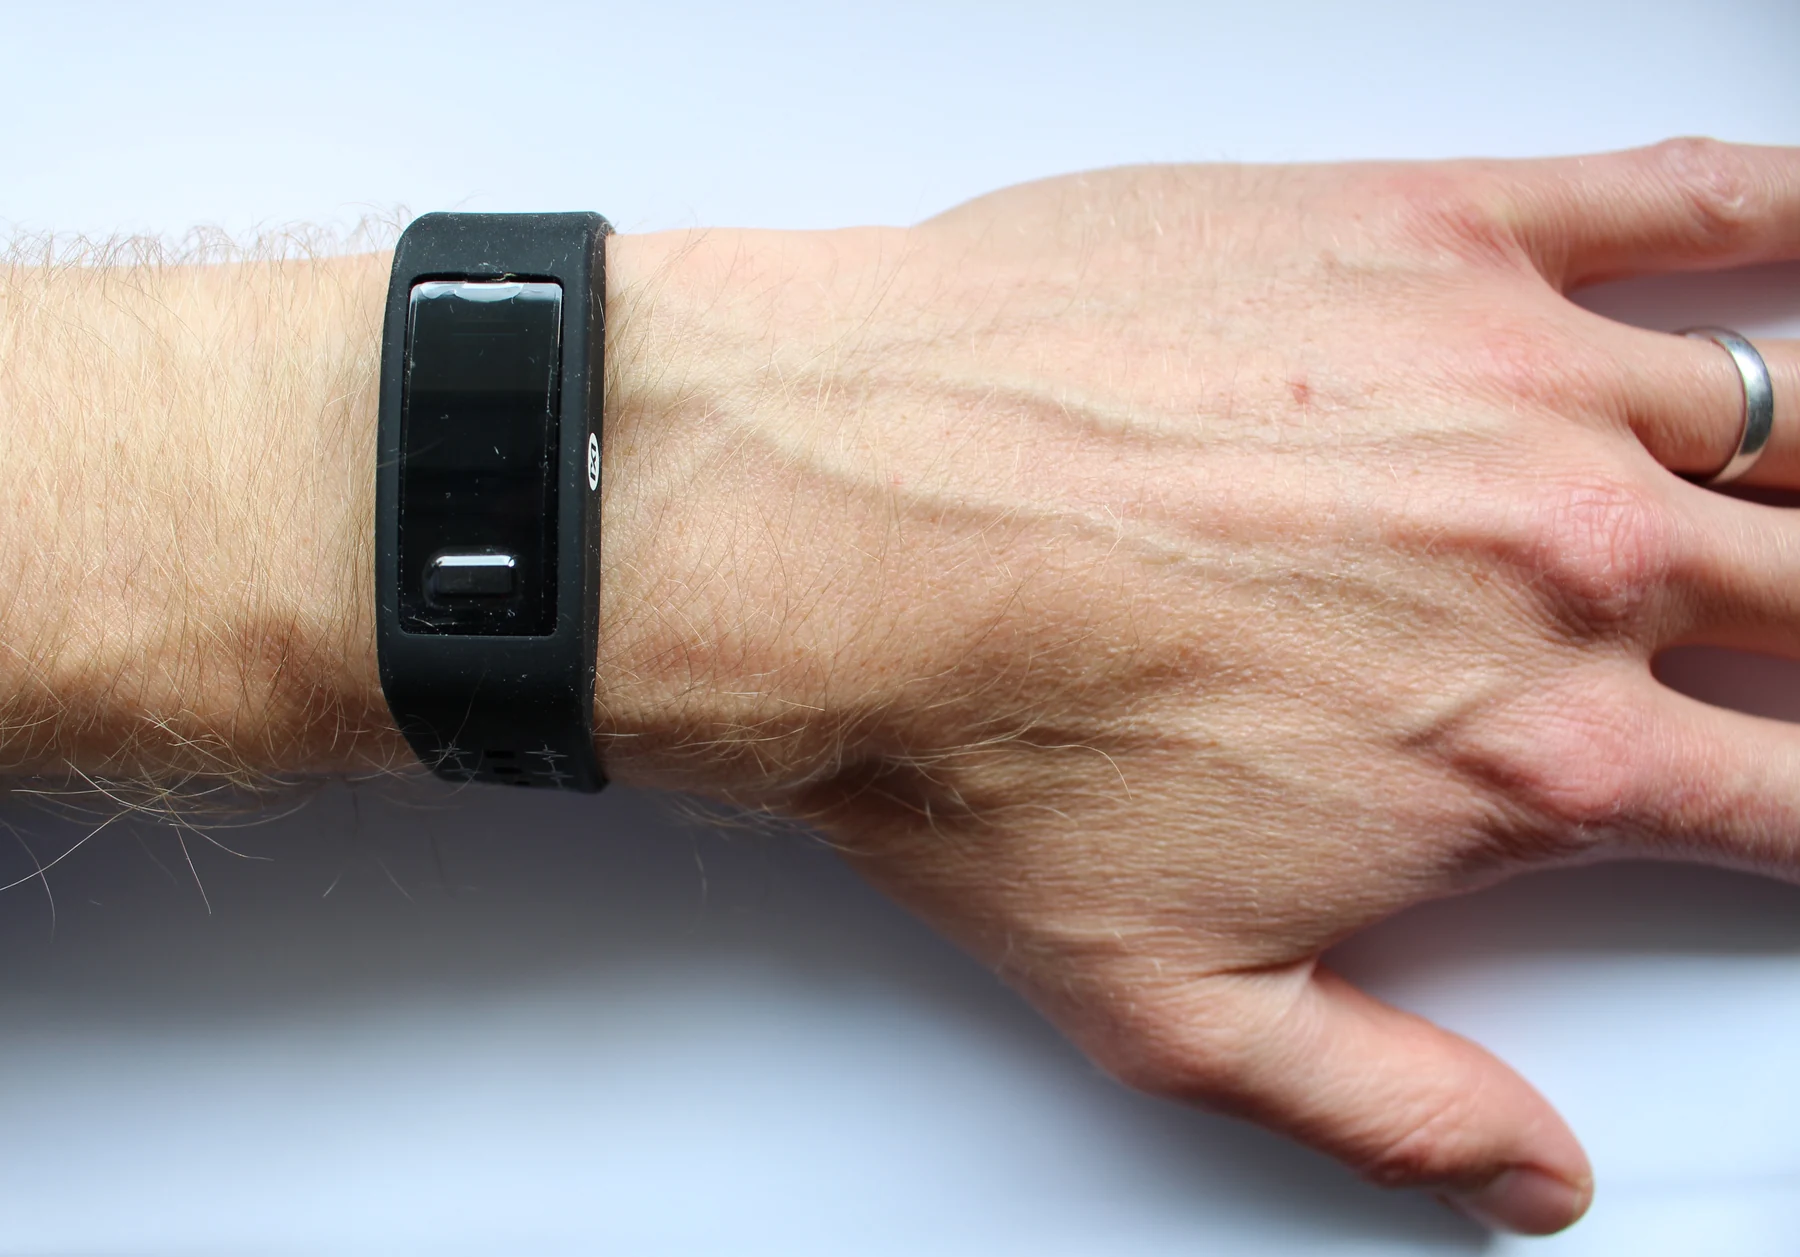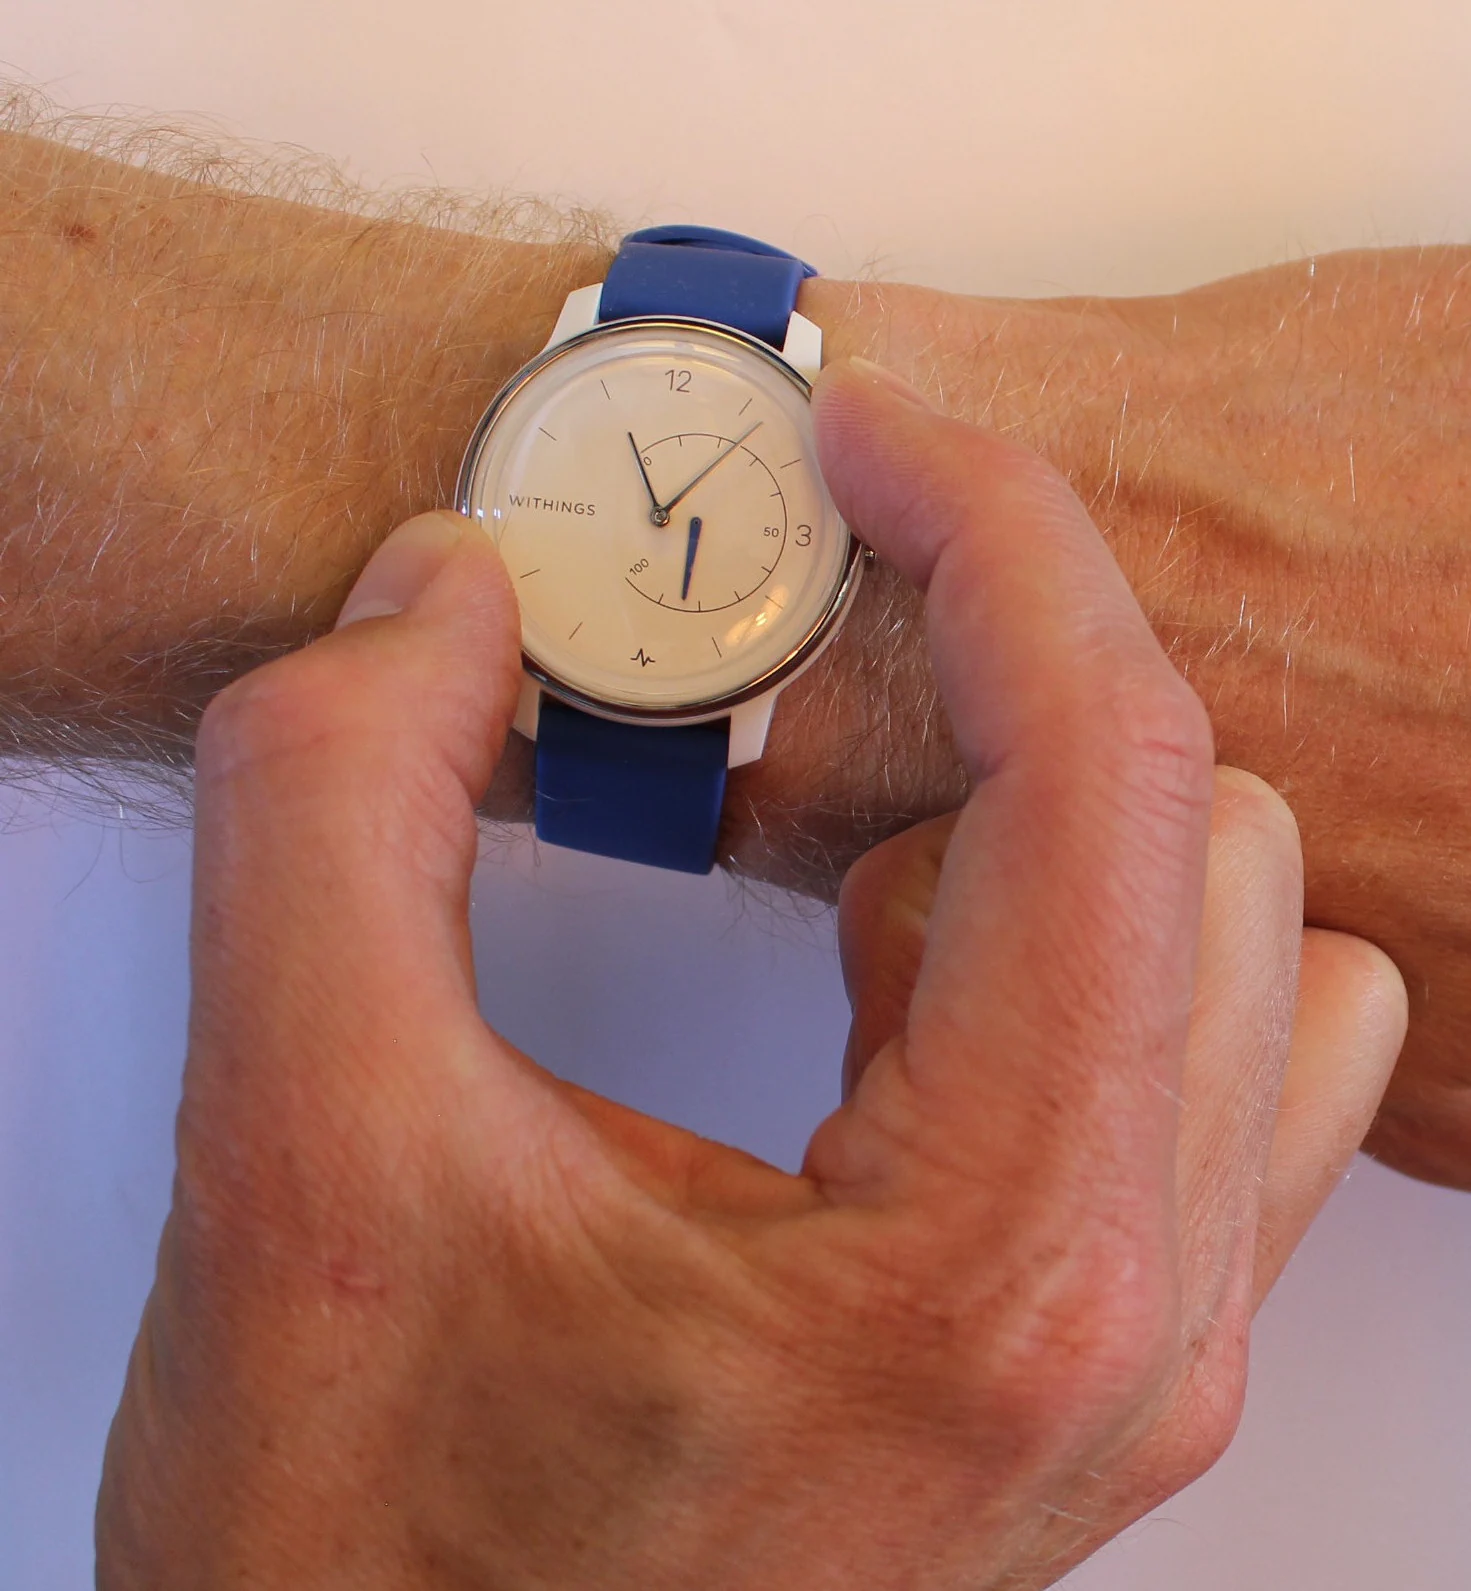
What does a normal ECG tell us about a heart? It says that, during the few minutes of recording, the electrical pattern reaching skin sensors did not show a detected abnormality. That is valuable information, but it is a narrow view: the test records electrical signals, not every aspect of pumping, blood supply, or symptoms that come and go. Understanding the boundary makes the result easier to interpret.
A surface map of electrical timing
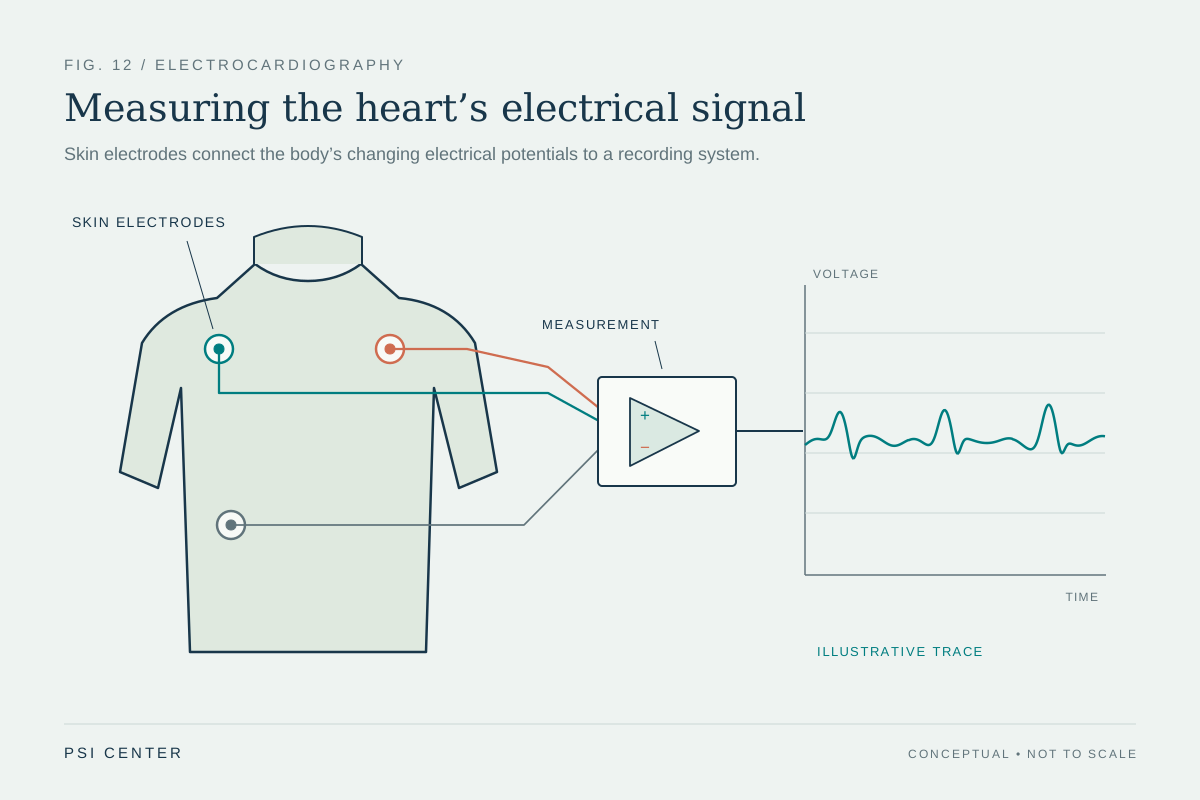
An electrocardiogram (ECG, also called an EKG) measures voltage changes associated with the heart’s electrical activity. Small electrodes stuck to the arms, legs, and chest detect signals that travel through the body; the machine records them as changing lines. The device does not send electricity into the heart. It listens to the electrical consequences of the heart’s coordinated beat. [1]
The familiar waveform has components linked to different stages of activation and recovery. The P wave reflects activity in the upper chambers, the QRS complex the activation of the lower chambers, and the T wave their recovery. Clinicians can use the shape, spacing, and regularity of these signals to assess rate, rhythm, and conduction timing. The tracing is a projection from multiple sensor positions, rather than a direct picture of the heart muscle.
Why a brief recording can look normal
Imagine a short recording of a busy road taken during a quiet minute. It can accurately show that minute without revealing a traffic jam that happens later. A standard ECG is similarly a snapshot: if an electrical disturbance occurs only occasionally, it may not happen while the electrodes are connected. A normal tracing therefore means no relevant irregularity was detected in that recording; it does not prove that every moment is normal. [1]
For symptoms that recur unpredictably, clinicians may consider longer recordings. A Holter monitor records continuously during ordinary activities for a limited period, while event monitors are designed to capture episodes over longer spans, either when activated or when the device detects an event. These tools change the sampling window. They do not make every possible cause visible, but they can increase the chance that an intermittent electrical event coincides with a recording.
Electrical signals are one part of heart function
The ECG is not a complete inventory of structure or performance. It can provide clues about chamber size or position, but it does not directly measure how much blood the heart pumps with each beat, show every valve’s movement, or map coronary arteries. Different tests answer different questions. A clinician may combine an ECG with examination, medical history, laboratory tests, or imaging when the question extends beyond electrical timing. [1]
A useful distinction is between a measurement and a diagnosis. A tracing can show a pattern that raises concern, but the pattern must be interpreted in context; an abnormal result does not identify one condition automatically, and a normal result cannot settle every question. Medical devices can monitor, stimulate, or support body functions, but their measurements have defined purposes and limits. Wearable sensors likewise provide particular kinds of data rather than a universal verdict on health. [2]
Matching the tool to the question
Suppose someone notices a flutter once every few days. A brief ECG taken between episodes might show ordinary rhythm, while a longer monitor could record during an episode. If the concern is instead about heart structure or blood flow, a rhythm tracing alone may not address it. The choice of test follows the physical question: what signal, event, or structure needs to be observed, and over what span of time?
This is why “normal” is best read precisely, not expansively. It describes the finding in a particular measurement under particular conditions. ECGs remain quick and useful tools for looking at rate, rhythm, and electrical timing, and they can contribute to assessing many heart conditions. Their value is strongest when the result is treated as one carefully bounded piece of evidence among the other information relevant to the person and the question. [1]
Explore the physics: an explanatory diagram
Sources & further reading
- Electrocardiogram MedlinePlus
- Medical Device Technologies NIBIB
Prepared for the independent PSI Center reading library. About edition dates and source checking.
This explainer describes scientific principles. It does not assess individual treatment choices.