A blood-vessel image can show where arteries run without showing how flow divides among them. A study published on 19 November 2026 tested a four-dimensional ultrasound cerebral angiography method designed to add that time-dependent flow information. In two macaques, it visualized the Circle of Willis and quantified flow patterns through the intact skull. The work is a preclinical imaging-method study, not a human diagnostic trial or evidence that the method improves care. [1]
What the fourth dimension adds
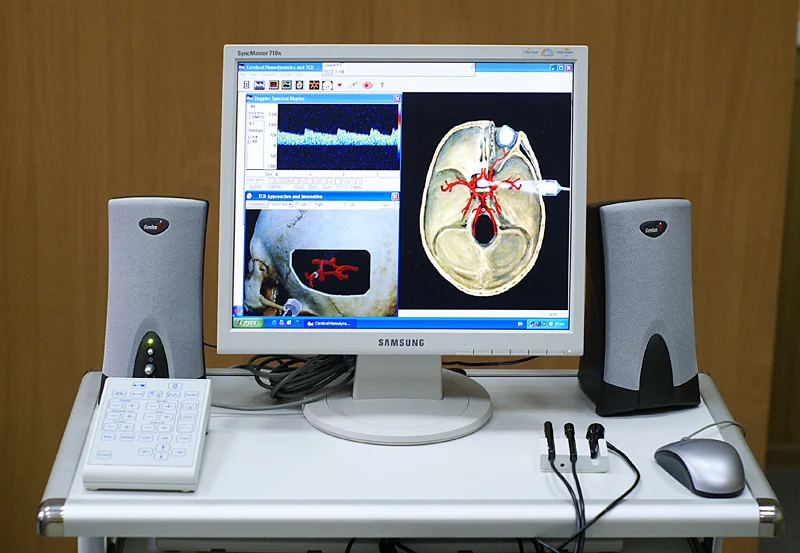
In imaging, “4D” usually means a three-dimensional volume tracked over time. It does not mean a fourth spatial direction. A static angiogram can outline vessels, while a time sequence can also capture moving blood and changing flow. The Circle of Willis, a network of arteries near the brain’s base, is useful for studying this distinction because blood can arrive through more than one major route and divide at connected branches. [1]
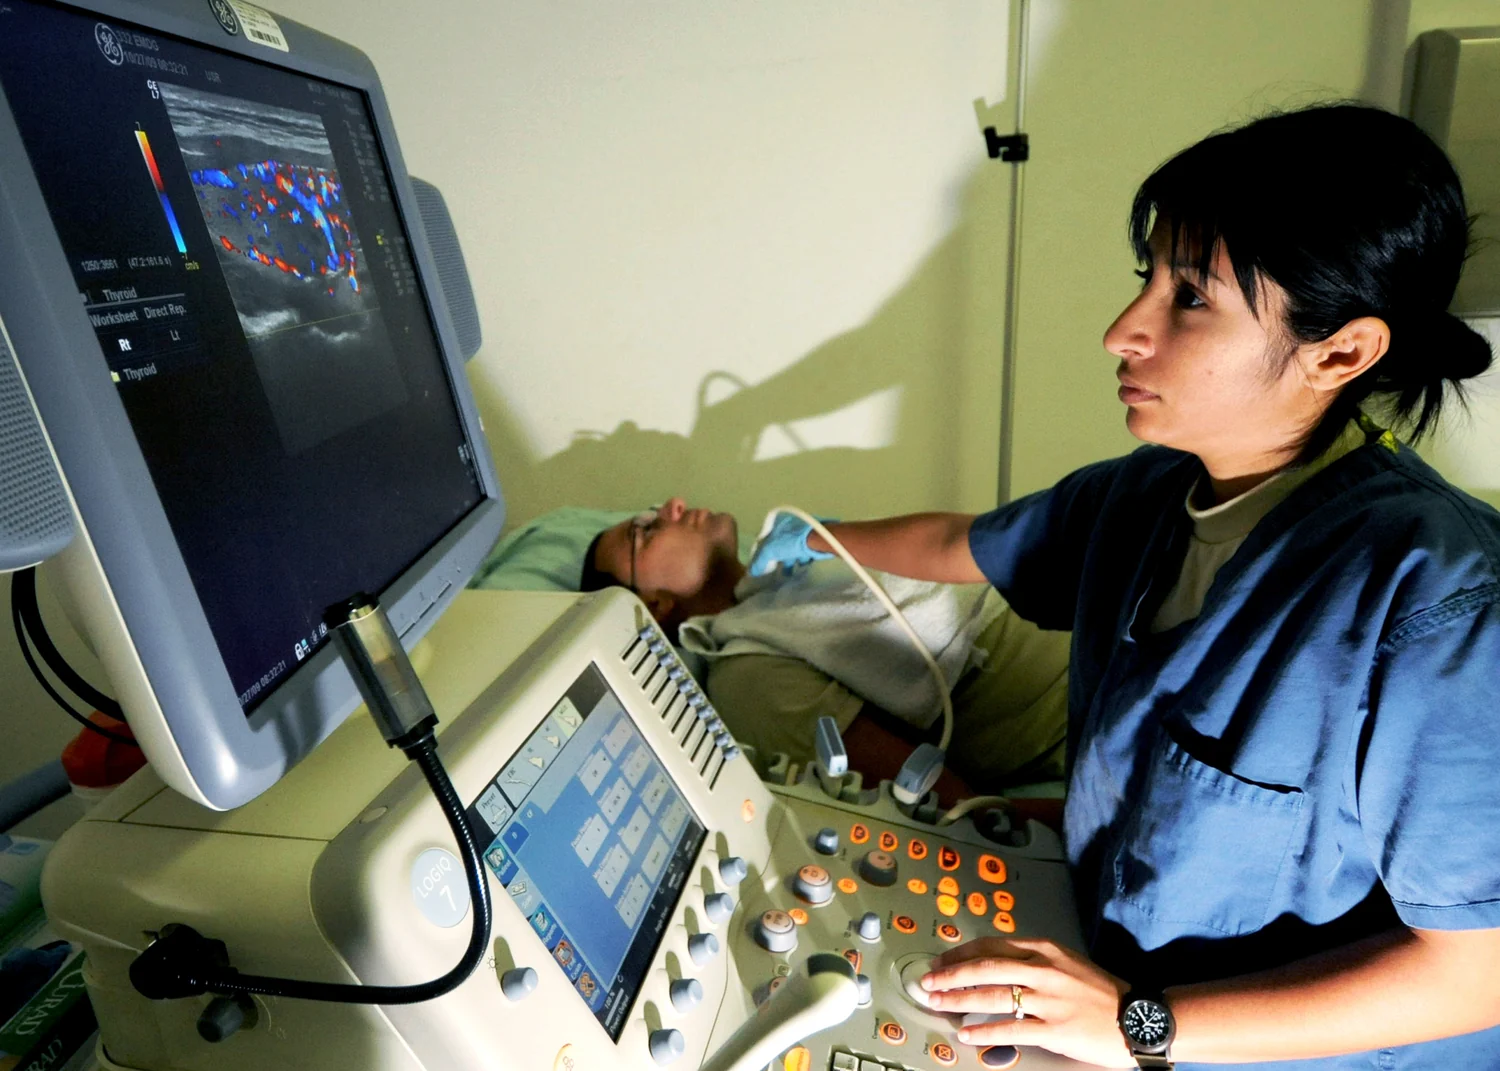
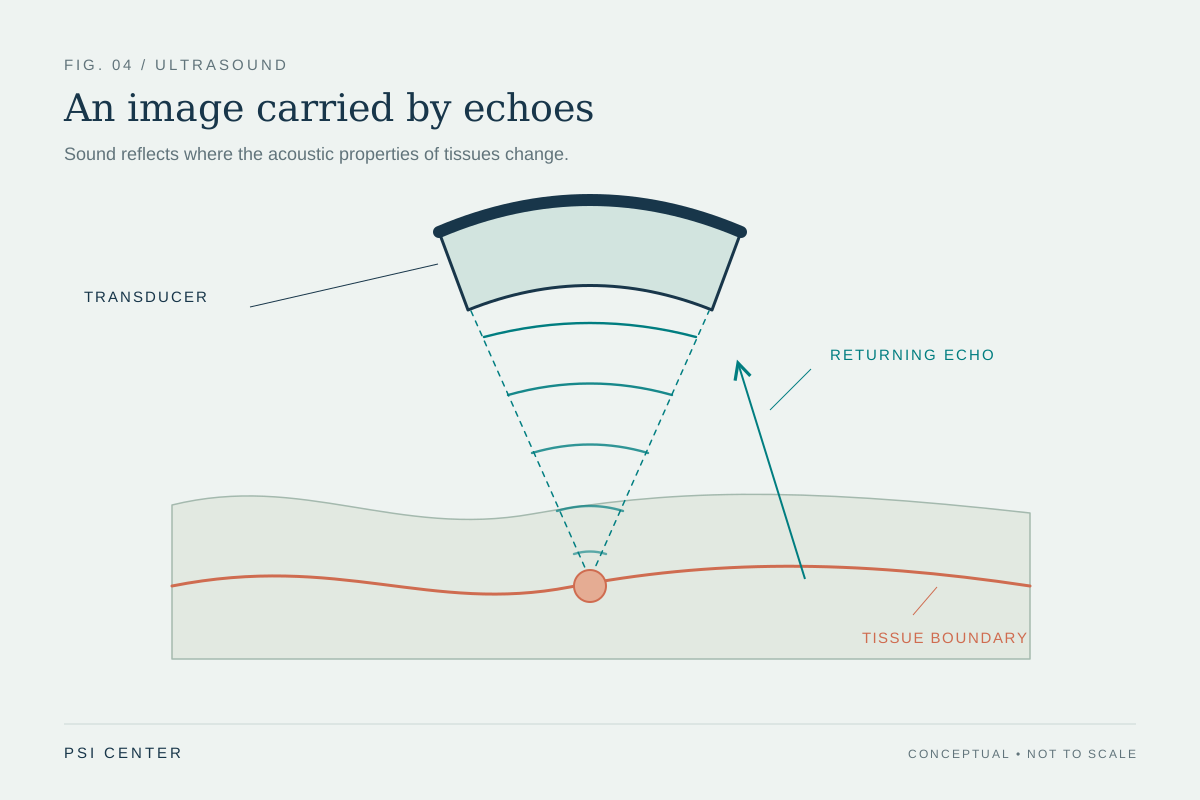
Ultrasound normally makes images from echoes: a transducer sends sound into the body, then records returning waves. In this study, the team used injected microbubbles as moving acoustic scatterers. By recording and tracking their signals across rapid 3D acquisitions, the method could estimate vessel paths and flow direction. It is a specialized research system, not simply a conventional ultrasound setting. [1] [3]
Why imaging through the skull is difficult
The skull attenuates and distorts sound, which can reduce sensitivity and make deep vessels hard to resolve. This is one reason cerebral ultrasound has often had restricted coverage or depended on acoustic windows. The new system combined hardware built for transcranial imaging with acquisition and processing choices aimed at recovering vascular signals through the intact macaque skull. [1]
Earlier work on three-dimensional ultrasound localization microscopy in macaques illustrates the engineering progression. That study reported deep brain vascular imaging with a craniotomy and also demonstrated transcranial imaging at similar depth with a different probe. The 2026 method’s intact-skull Circle of Willis measurements extend this line of research, while the two studies use different setups and should not be treated as a direct head-to-head comparison. [2] [1]
What the study measured
The authors reported imaging at depths up to 7 centimetres in nonhuman primates. Their mapped volumes covered roughly 2.5 by 3.5 by 4 centimetres; microbubble tracking used a 279-hertz volumetric rate, and the reported spatial resolution after a three-minute acquisition was 151 micrometres. These numbers describe different parts of the measurement: rapid volume updates support tracking, while the final vessel map is assembled over a longer acquisition. A high update rate does not mean a complete, high-resolution angiogram appears in a fraction of a second. [1]
The work included two macaques and showed both larger arteries and smaller branches, including differences between individuals. The team also analyzed how flow contributions split at arterial junctions. For example, in one animal, the reported left internal carotid contribution divided almost evenly between anterior-middle and posterior circulation pathways. That is a measured flow-partition result in a particular animal and setup, not a normal reference value for people. [1]
A worked way to read a flow split
Suppose a measurement reports that a source vessel supplies 100 arbitrary flow units before a junction, and the reconstructed branches receive 51 and 49 units. The useful interpretation is that the two measured pathways shared flow nearly evenly under those experimental conditions. It would be a mistake to conclude that the split is fixed, that every person has the same anatomy, or that the numbers predict what happens during a blockage. Real flow depends on vessel geometry, pressure differences, physiological state, and how the imaging system samples and reconstructs moving bubbles. The example illustrates how a branch percentage describes a network measurement rather than a health score. [1]
What remains uncertain
Two animals can establish feasibility and reveal candidate measurements, but they cannot establish how well a method works across human skull thicknesses, head shapes, ages, or clinical conditions. Nor does a detailed map alone show that a measurement changes diagnosis, treatment decisions, or outcomes. The authors describe their work as a methodological framework and a basis for future translation, not as an established clinical tool. [1]
Further steps would need to test repeatability, measurement accuracy against suitable references, performance across more subjects, and practical constraints such as acquisition time and contrast-agent use. Comparisons with existing imaging would need to ask which specific question each method answers: vessel anatomy, velocity, flow distribution, or changes over time. Each is a different measurement target.
A measurement advance, not a treatment claim
Functional ultrasound can combine anatomical images with information about tissue or blood motion, but imaging and therapy are separate uses of sound. A method that visualizes blood-flow pathways does not itself open vessels, prevent stroke, or treat a neurological condition. The practical contribution here is more limited and more precise: a way to study deep cerebral arterial flow in a primate model with volumetric, time-resolved ultrasound. [3] [1]
If future validation succeeds, researchers may gain a way to examine how flow redistributes through connected cerebral arteries. For now, the most informative result is that transcranial ultrasound can capture a richer map in this experimental setting—and that moving from a research demonstration to a reliable human measurement remains a separate task.
Explore the physics: an explanatory diagram
Sources & further reading
- 4D ultrasound cerebral angiography reveals the hemodynamics of the circle of Willis in primates Nature Methods (2026)
- 3D ultrasound localization microscopy of the nonhuman primate brain EBioMedicine (2025)
- Ultrasound National Institute of Biomedical Imaging and Bioengineering (2022)
Sources checked: 21 November 2026. The calculations illustrate physical models; they are not clinical settings.
Prepared for the independent PSI Center reading library. About edition dates and source checking.
This explainer describes scientific principles. It does not assess individual treatment choices.