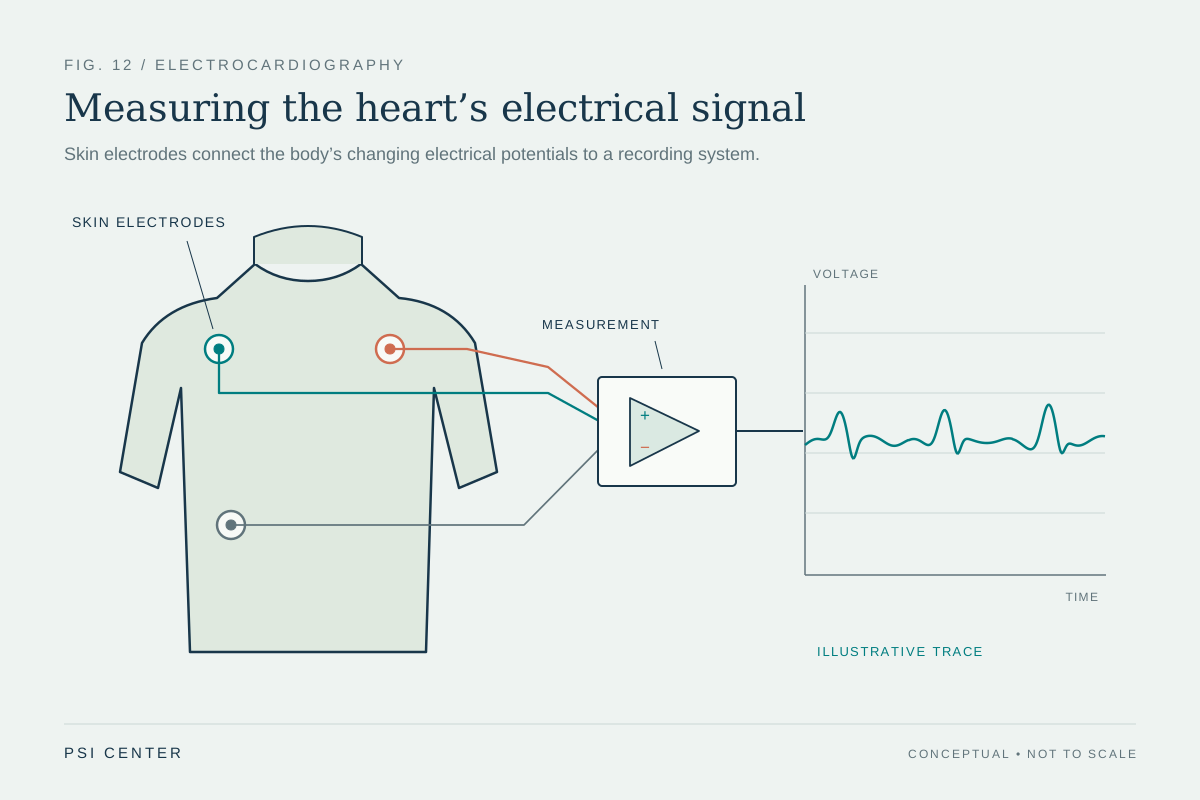
What does a small adhesive electrode on the chest actually detect? It does not listen to the heartbeat or send electricity through the body. It senses tiny voltage differences at the skin that arise as electrical activity moves through the heart. Several electrodes, connected to a recording system, turn those differences into a pattern clinicians can interpret alongside symptoms, history, and other tests.
The heart creates moving electrical signals
Each heartbeat is coordinated by electrical activity in heart muscle. The signal spreads through the chambers, helping them contract in a sequence that pumps blood. As charged particles move within and around the heart cells, they create electrical fields that extend through the body. Skin electrodes can detect resulting voltage differences, even though the heart itself is deep inside the chest. [1]
Think of a crowd doing a stadium wave. A person in one seat does not cause the motion; they register a changing pattern as the wave passes. An ECG is not literally measuring a wave of people or a mechanical pulse. Its electrodes provide viewpoints on the changing electrical field, and the instrument records the differences over time.
Electrodes are sensors, not stimulators
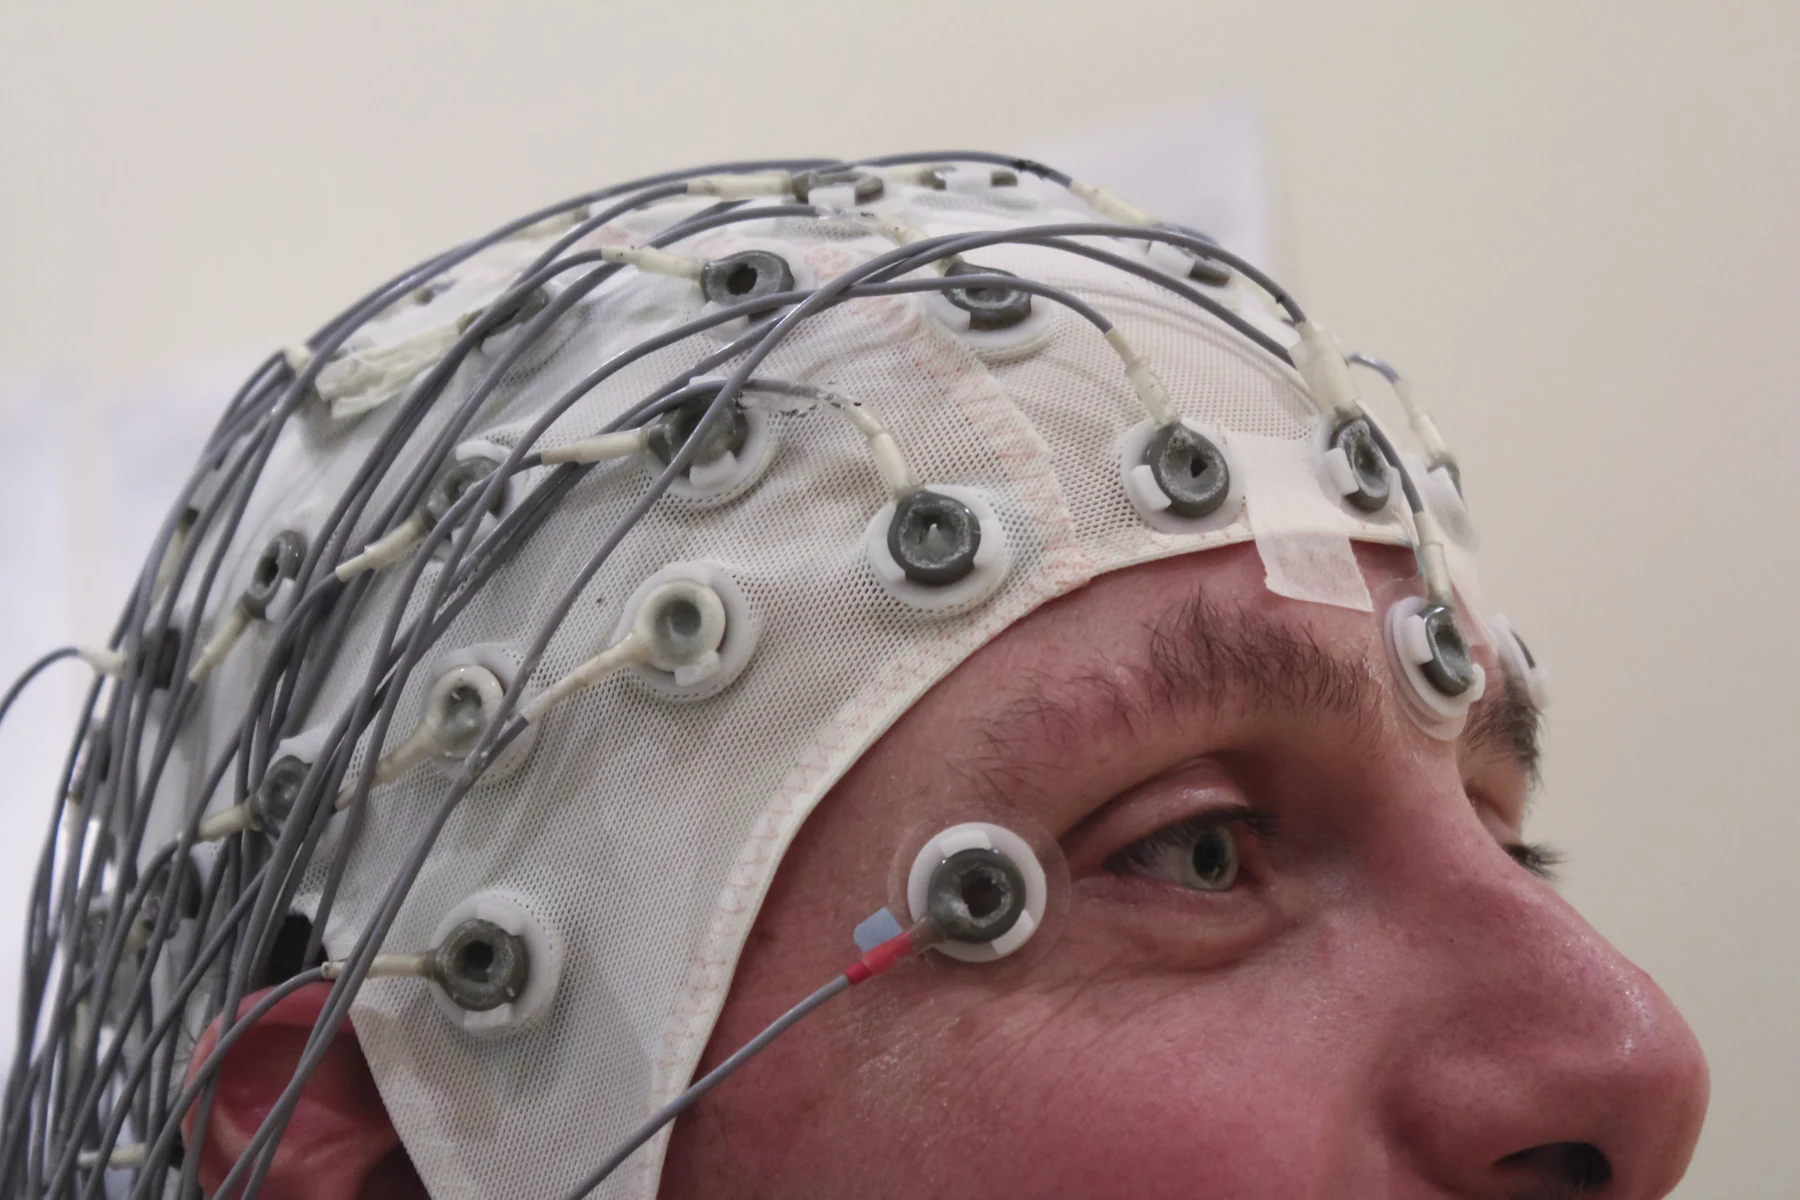
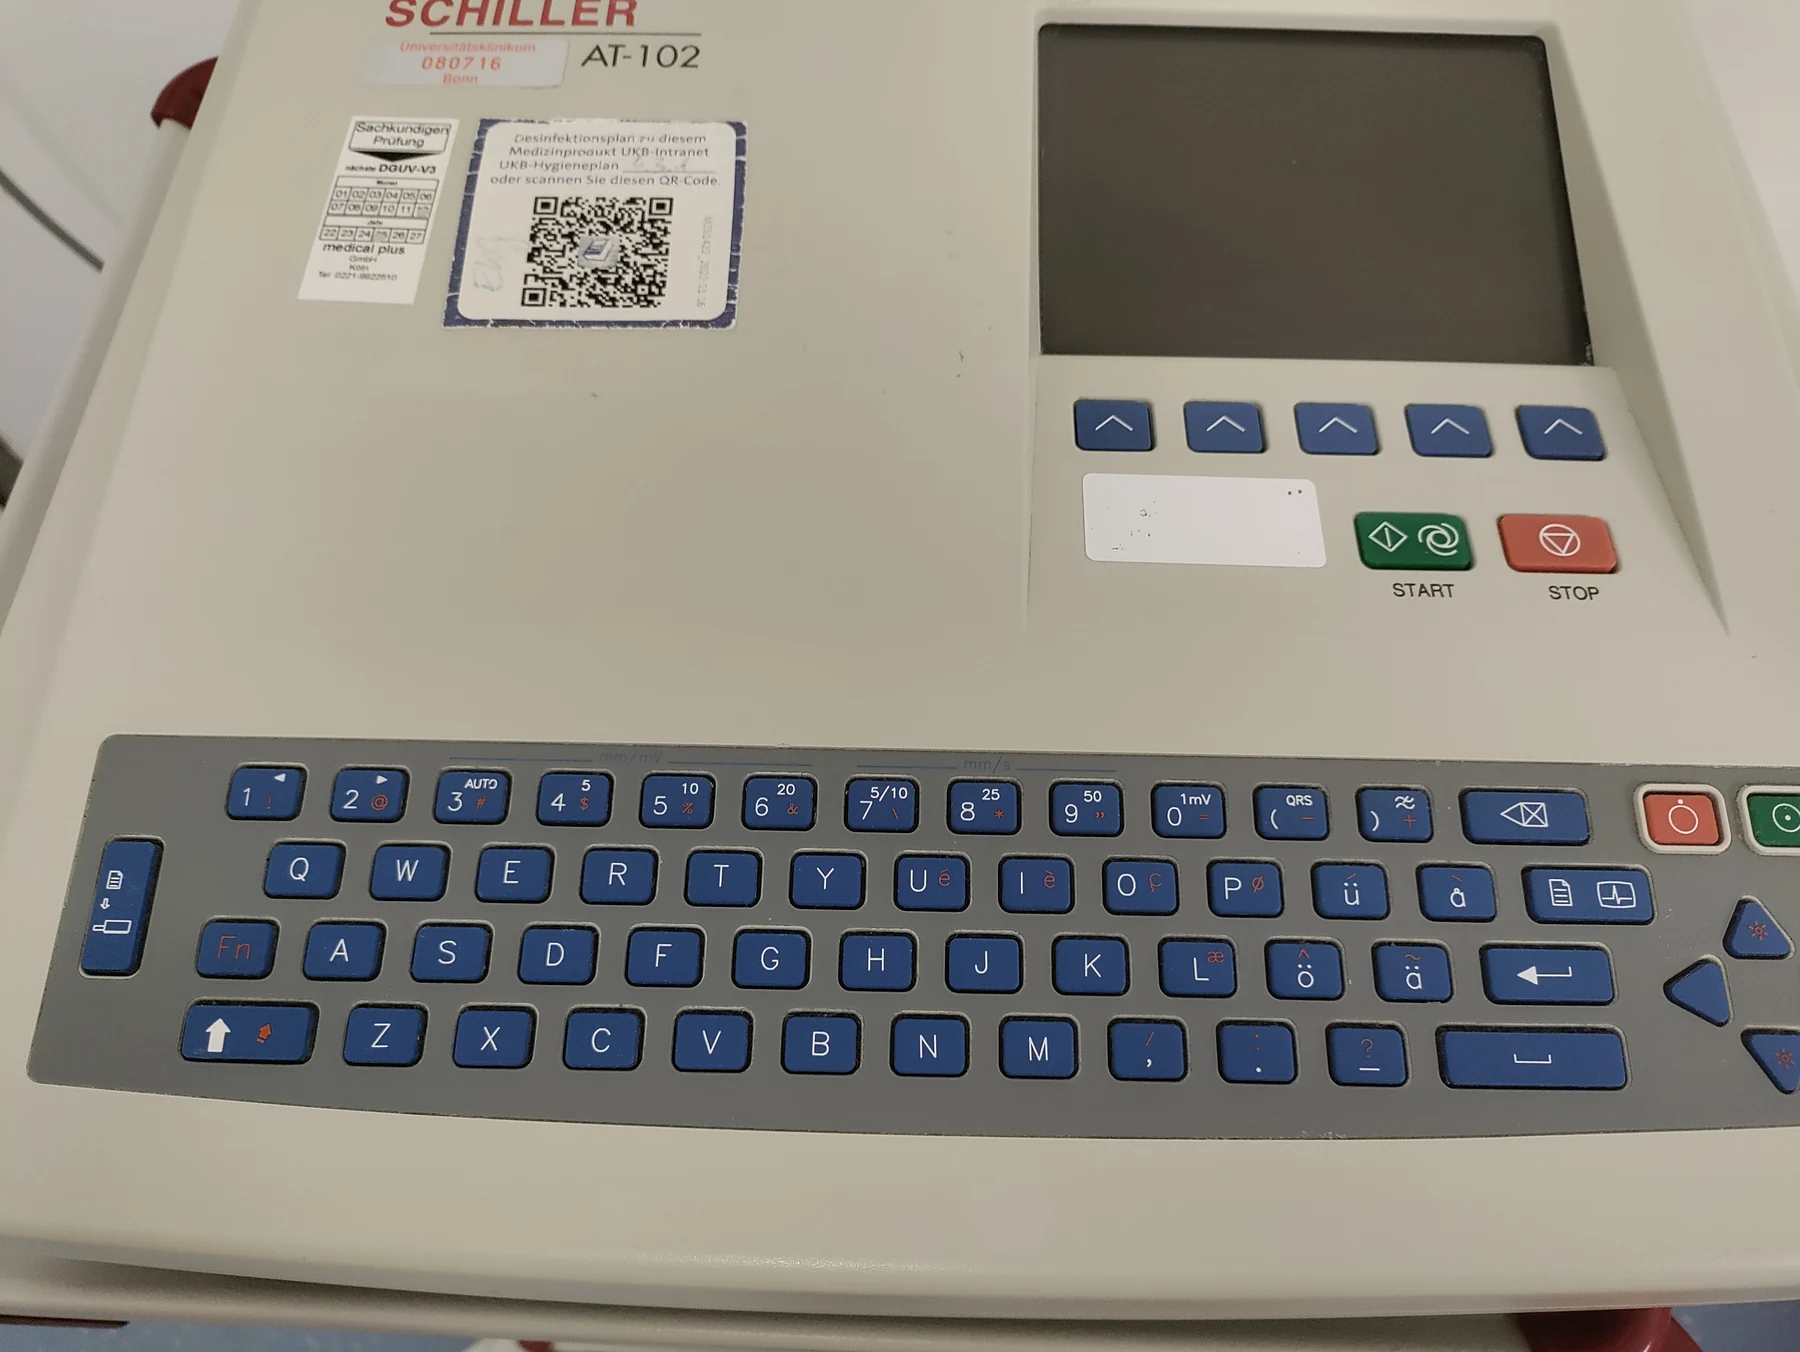
An electrode is a conductive contact between the skin and the recording device. In a standard test, several are placed on the arms, legs, and chest, then connected by wires to an ECG machine or computer. The machine records the heart’s electrical signals; the test itself does not deliver electricity to the patient. The electrodes are sensors, and the displayed trace is a record of sensed activity. [1]
This distinction matters because the word “electrical” can suggest stimulation. A pacemaker can deliver controlled pulses to influence rhythm; a diagnostic ECG does not do that. In broader biomedical sensing, devices detect many kinds of physical, chemical, or biological inputs and report them as data. A sensor’s output is a measurement of an input, not necessarily an action on the body. [2]
A tracing is assembled from viewpoints
The ECG’s familiar waves correspond to stages in the heart’s electrical cycle. The P wave reflects activity associated with the upper chambers; the QRS complex is the sharp pattern associated with the lower chambers; the T wave reflects recovery after contraction. Their shapes, timing, and spacing help clinicians assess rate, rhythm, and the timing of signals through different parts of the heart. [1]
The instrument combines electrical comparisons from different electrode arrangements into leads, each a particular viewing angle on the same changing activity. No single lead is a tiny camera aimed at one heart chamber. A pattern that looks small from one viewpoint may be more apparent from another, much as a three-dimensional object has different outlines from different angles.
A short record has limits
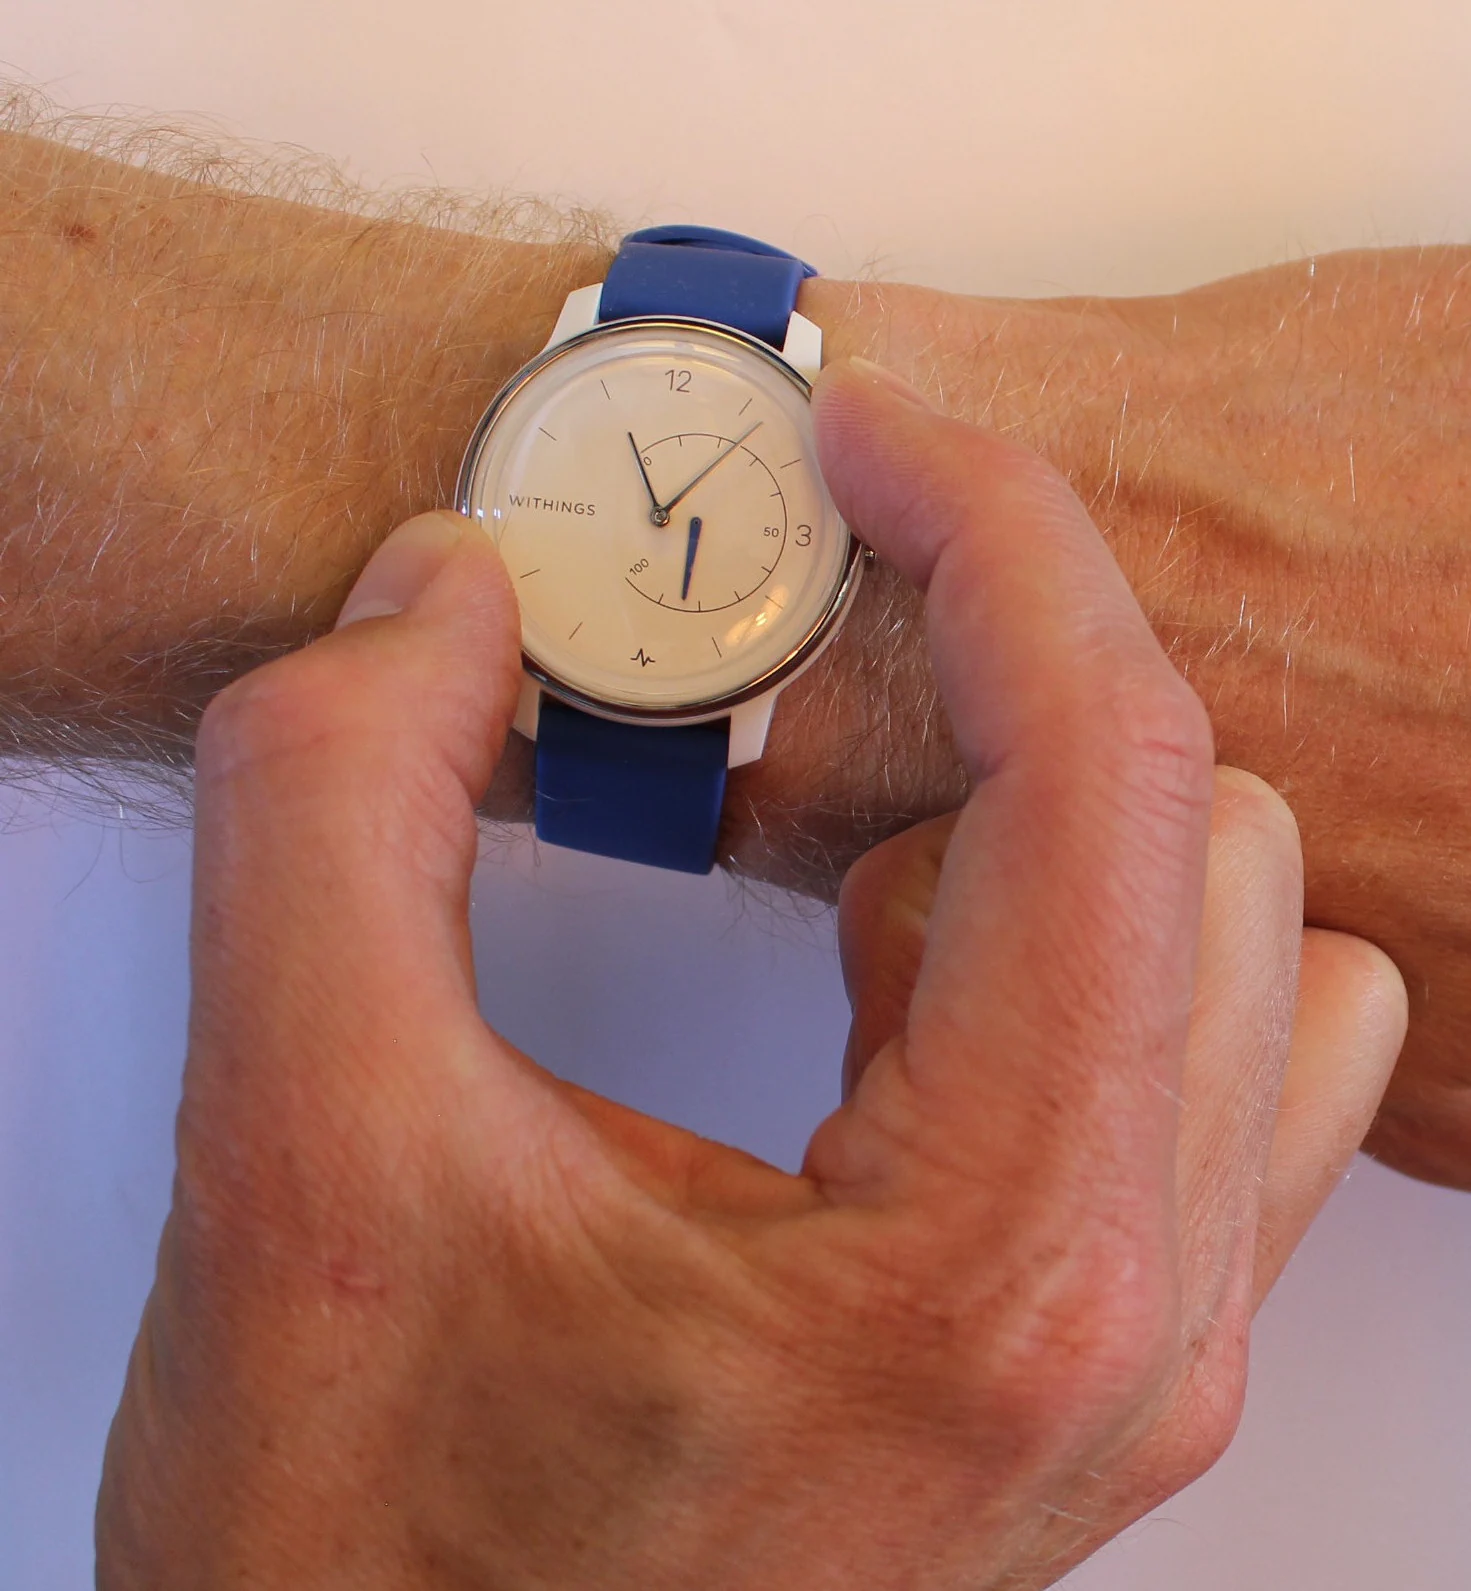
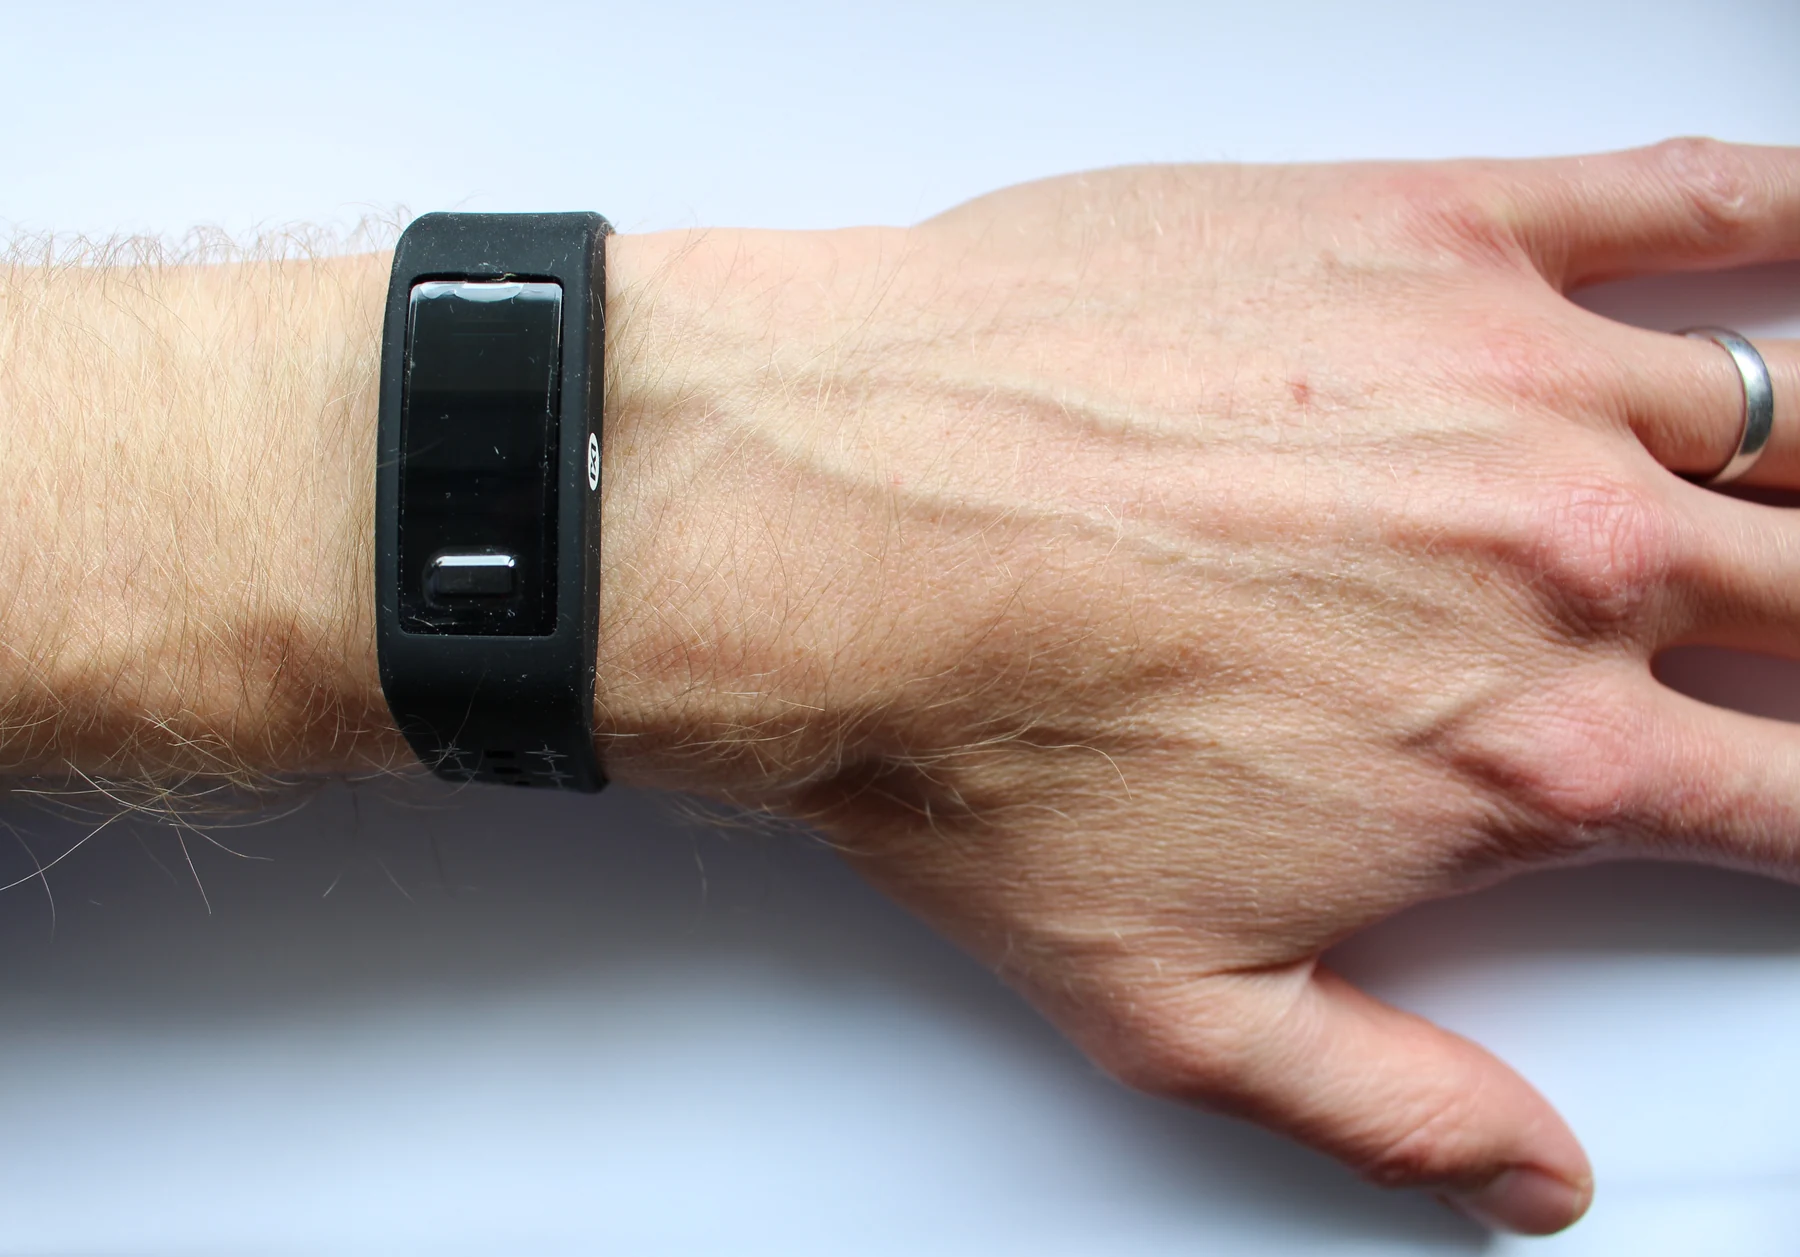
A standard ECG takes only a few minutes, so it is a snapshot. If an irregular rhythm happens outside that brief recording, the test may not capture it. For symptoms that come and go, clinicians may use portable monitors that record for longer periods; some record continuously, while event monitors capture activity when triggered or when the device detects an abnormal pattern. [1]
The trace can reveal clues, but it does not diagnose every heart condition on its own. Interpretation depends on which features are abnormal and on other information, including medical history and sometimes additional tests. Wearable sensors may track heart rate or other signals, but that broad category does not mean every wearable can diagnose disease. A sensor supplies data; clinical meaning requires context. [2]
Explore the physics: an explanatory diagram
Sources & further reading
- Electrocardiogram MedlinePlus
- Sensors NIBIB
Prepared for the independent PSI Center reading library. About edition dates and source checking.
This explainer describes scientific principles. It does not assess individual treatment choices.